
A pre-configured OTel pipeline, or bring your own.
Installing the Randoli Agent sets up a working OTel Operator, collector, and pipeline in your cluster automatically, forwarding to locally running telemetry backends out of the box. Standard OpenTelemetry underneath, nothing proprietary to learn.
What ships by default
The official OTel Kubernetes operator, managing auto-instrumentation for supported languages.
A pre-configured collector with custom processors that enrich data in-pipeline, ready to receive traces and metrics immediately.
Pipelines pre-wired to your local telemetry backends for metrics and traces, with logs correlated alongside them, all in one Randoli view.
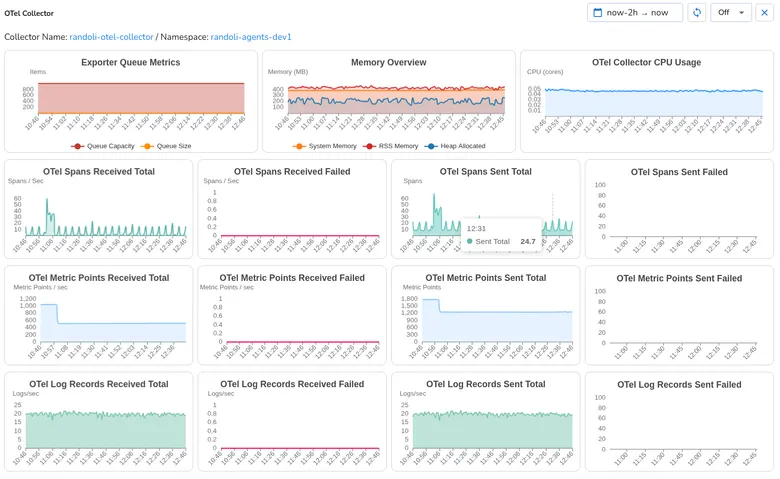
Built-in monitors and a dashboard tracking collector throughput, queue saturation, and resource usage, out of the box.
Bring your existing collector, no re-instrumentation required.
Connect any existing OTel Operator, custom collector, or pipeline via an OTLP exporter: no changes to existing instrumentation required.
Logs, correlated automatically, without OTLP overhead.
Metrics and traces flow through OTLP. Logs are the one default exception: Randoli uses Vector to ship logs into Loki for performance at scale, auto-tagging every log with its OTel service name and highlighting trace IDs with a direct link into the matching trace. Logs over OTLP specifically is also supported on request.
Language & framework coverage
Visibility into the pipeline itself, not just what flows through it.
Collector throughput, exporter queue saturation, memory pressure, and CPU usage across every active collector, in real time. Most teams find out their pipeline is falling behind from missing data. Randoli tells you before that happens.
Any OTel-compatible metric, visualized on any Grafana-compatible dashboard.
Any OTel-compatible metric source can feed the same pipeline, not just what Randoli instruments directly. Via Perses, any existing Grafana-compatible dashboard can visualize that data in Randoli, carrying over your existing dashboard investment.