The Future of Observability Is Federated

Federated Control Planes cut costs and put you in control of your telemetry data.

Get Started Free
A screen displaying an infrastructure overview dashboard, which includes host monitors, application monitors, and graphs.A screen displaying a cost overview with various cost metrics, including dormant workloads, workload rightsizing, and cost alerts, as well as a resource snapshot displaying multiple graphs.

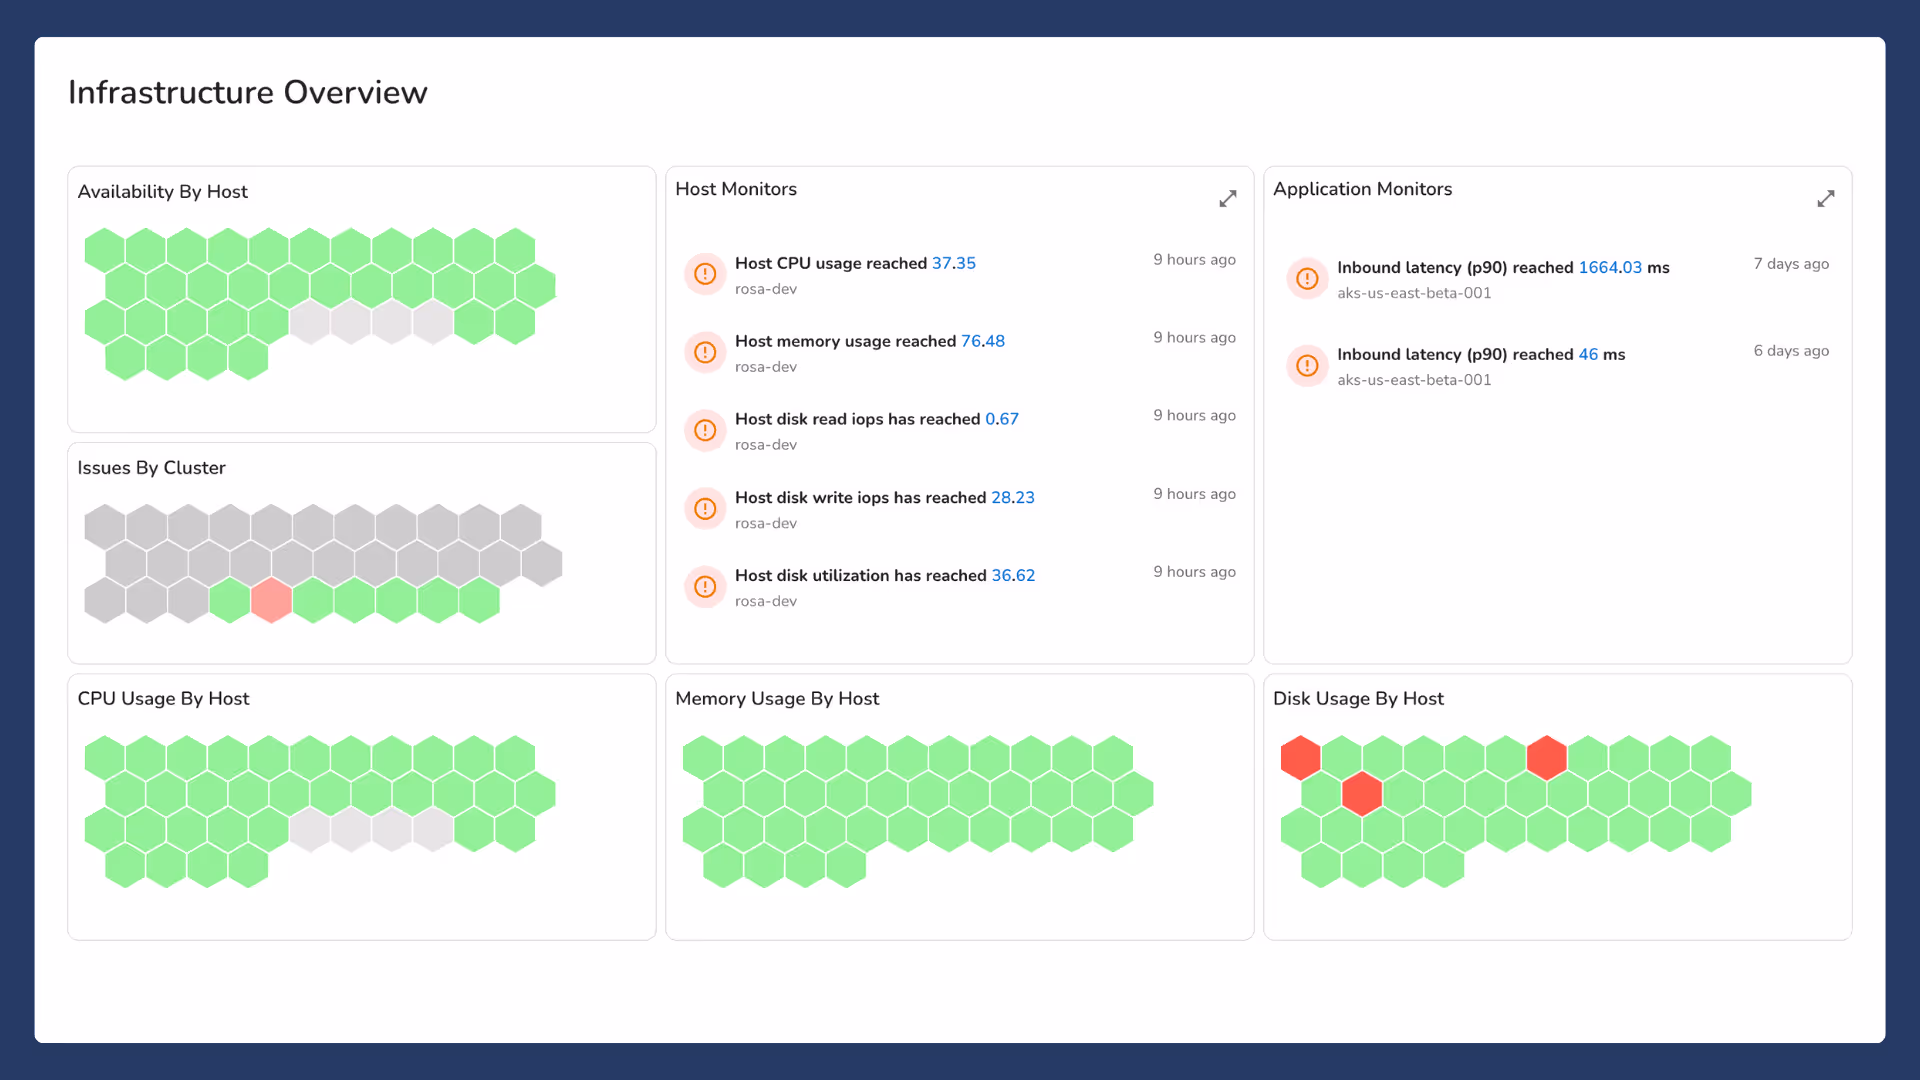
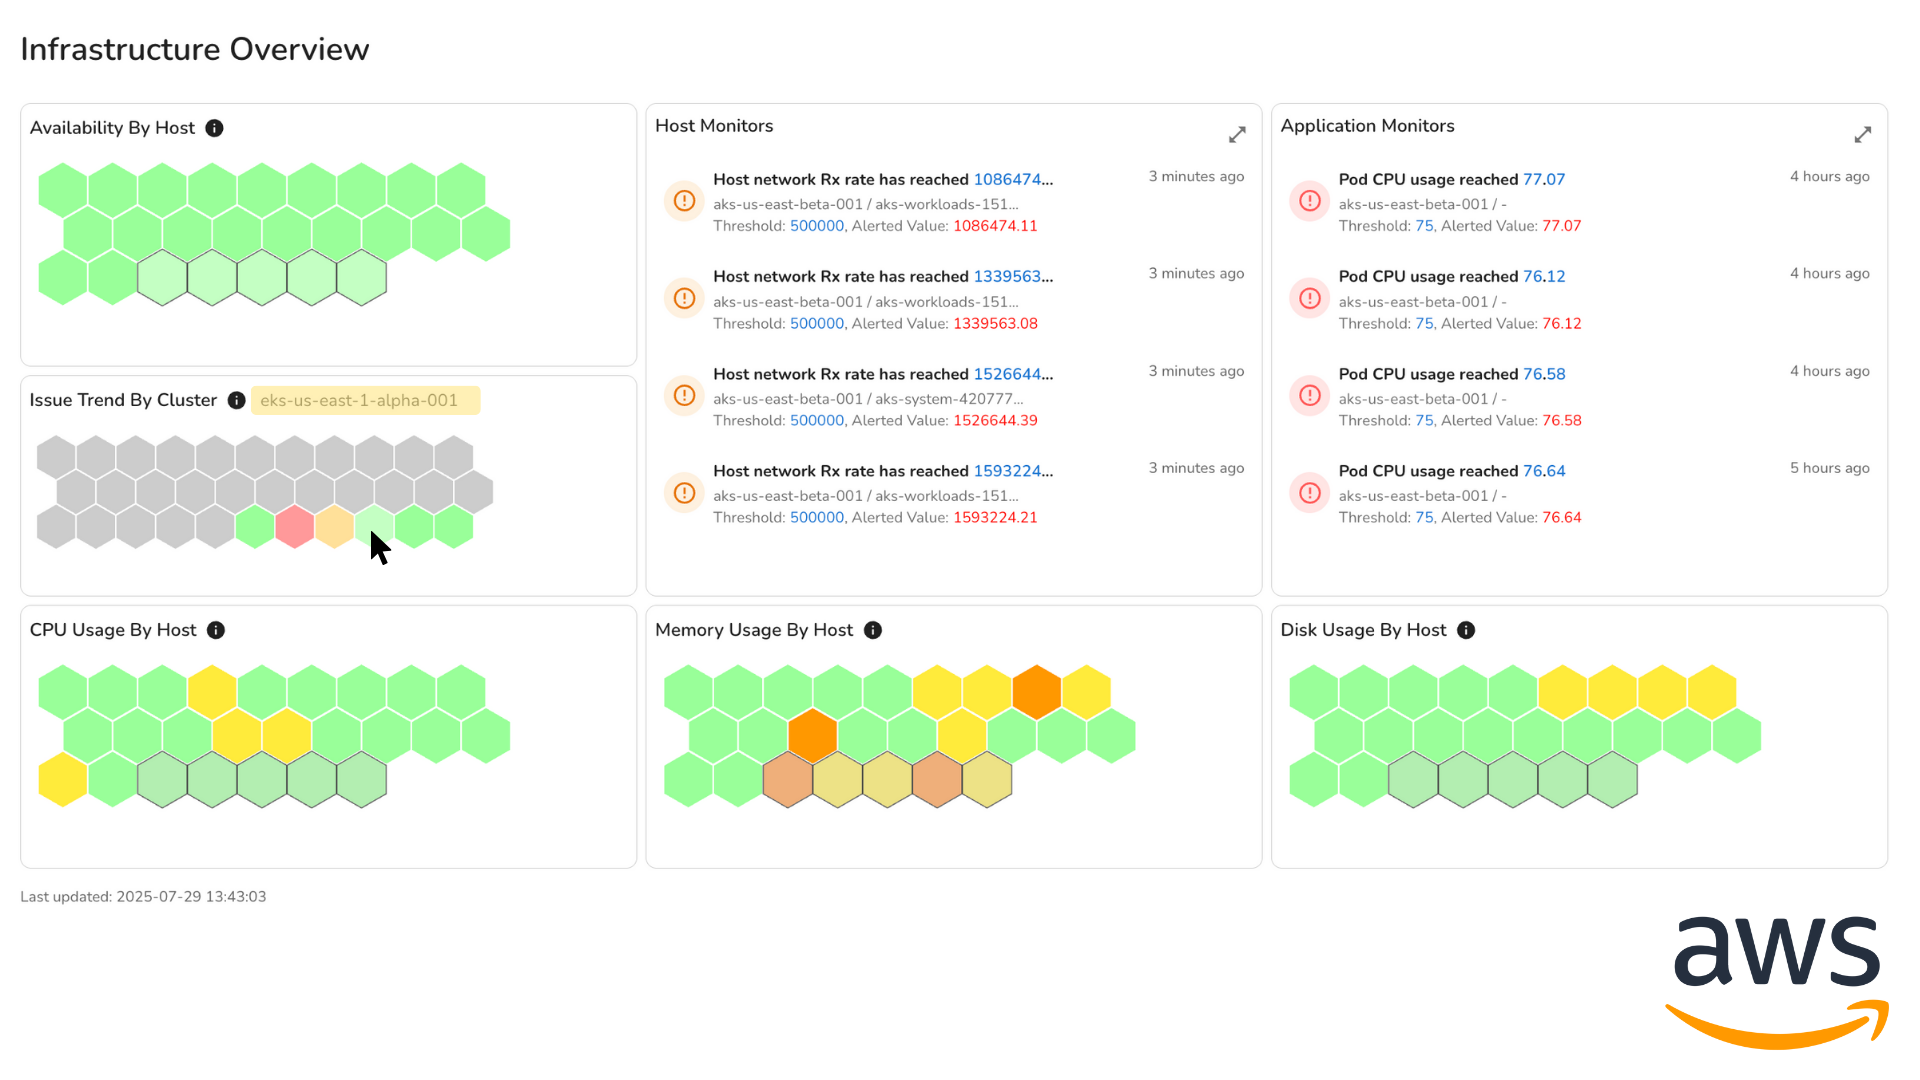
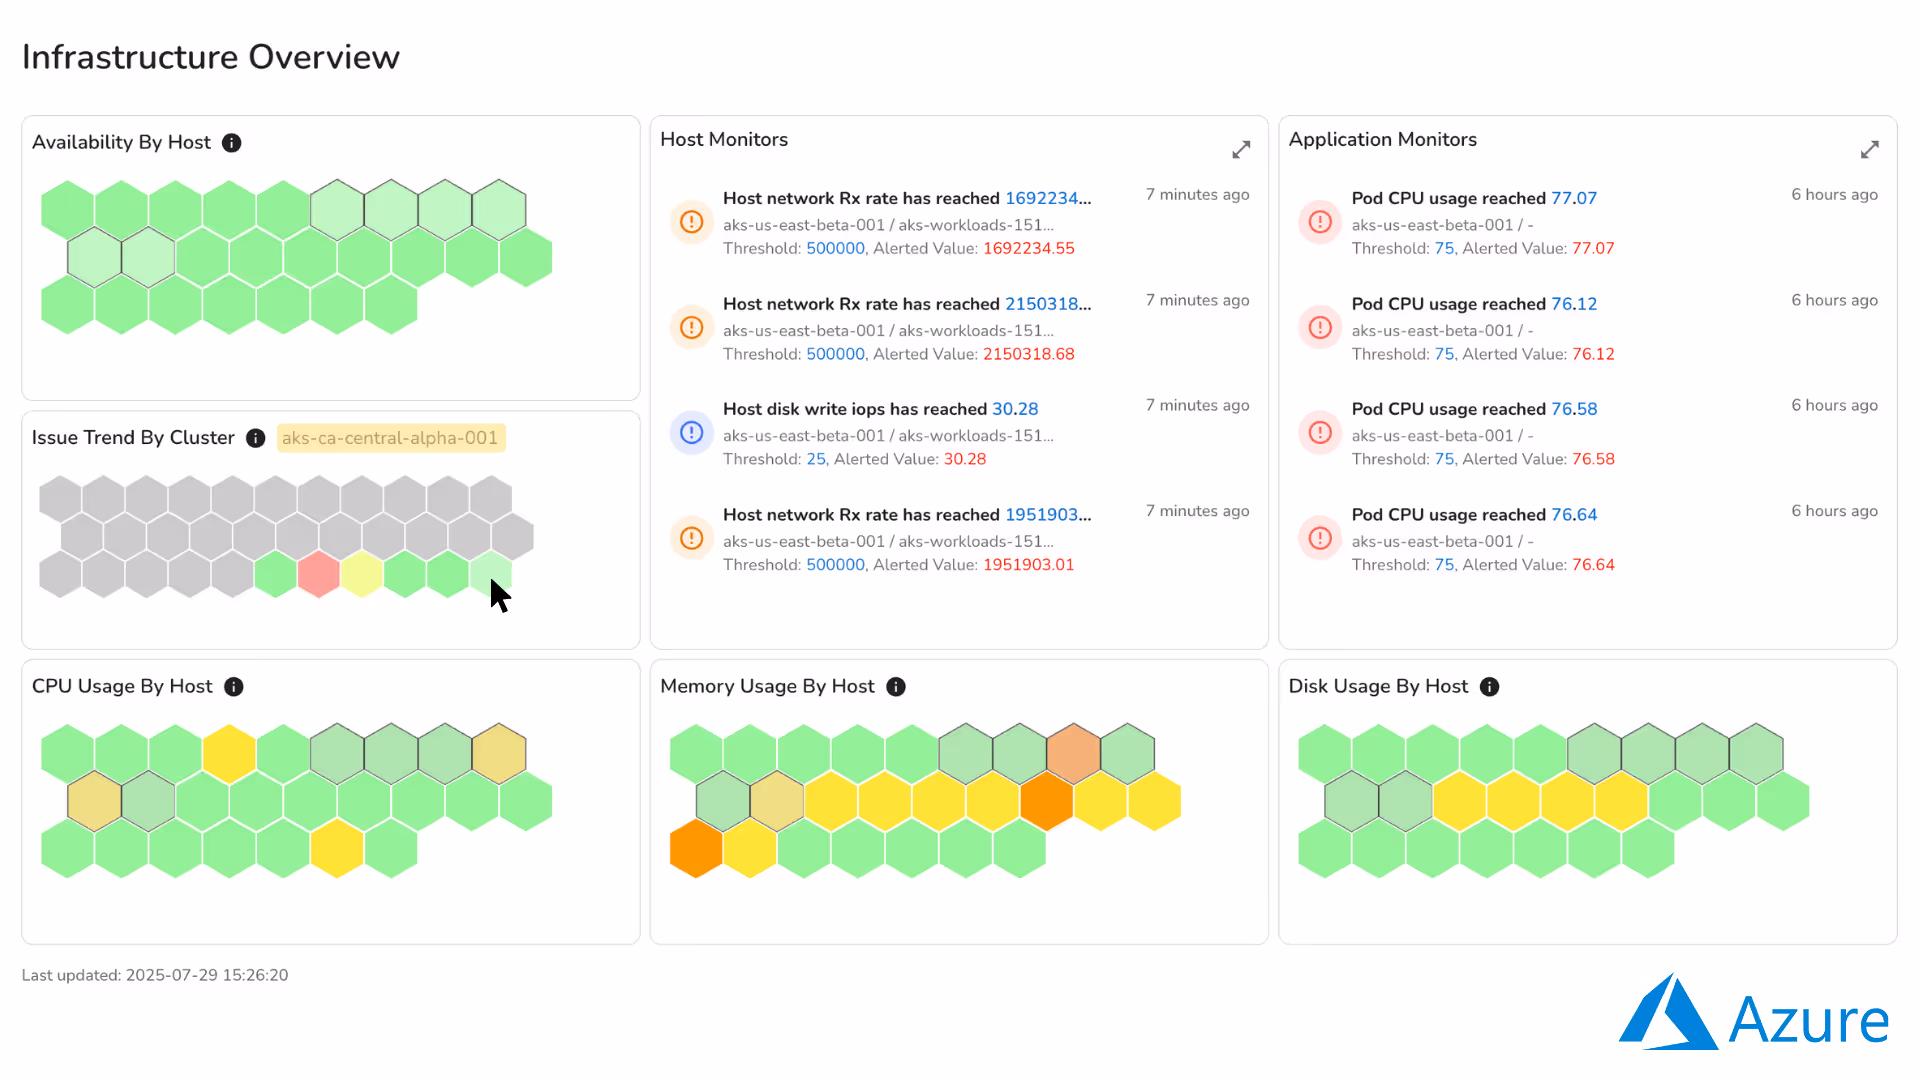
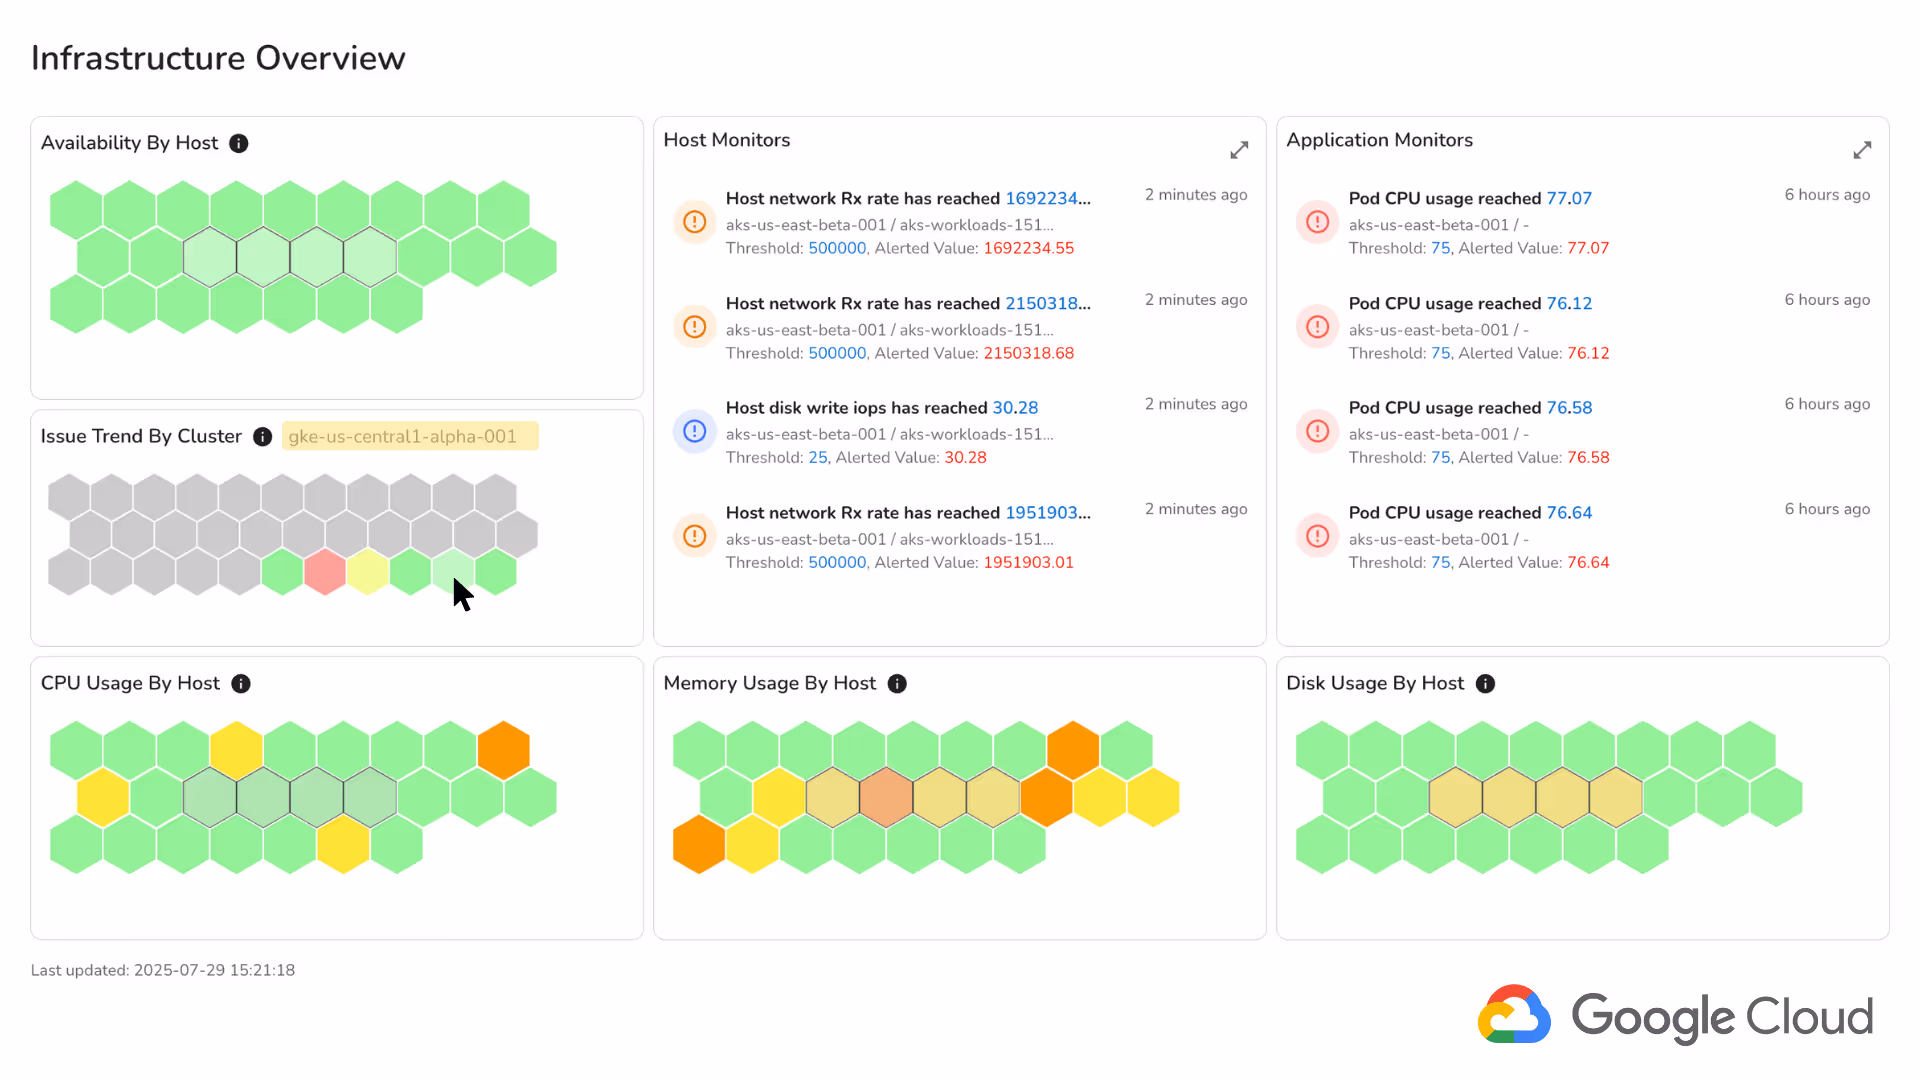
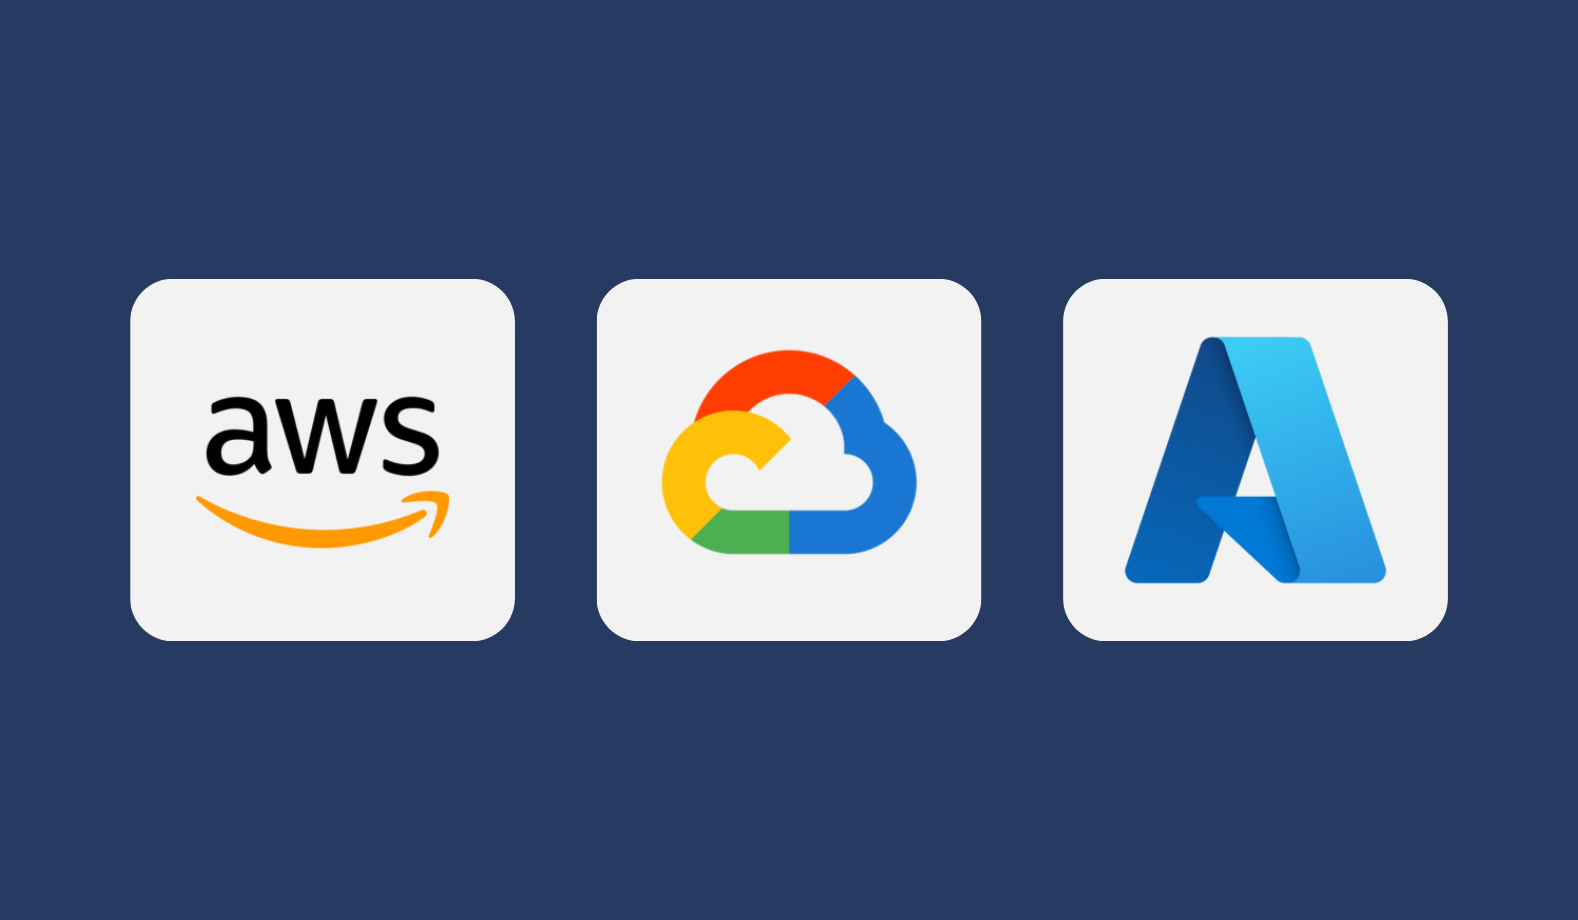
Explore Infrastructure & Platform

Randoli provides a single-pane observability experience for teams running infrastructure across AWS, Azure, GCP and on-prem. Eliminate tool sprawl, correlate signals across environments, and make faster, cost-aware decisions from one platform.

Infrastructure dashboard offering real-time visibility across your infrastructure, while cutting ingestion costs, reducing alert noise, and resolving issues faster – all under a single pane of glass.
Infrastructure Monitoring
Get real-time visibility across your infrastructure, while cutting ingestion costs, reducing alert noise, and resolving issues faster – all under a single pane of glass.
Learn More
Multi-Cloud Monitoring
Unified observability across your entire multi-cloud environment with real-time performance and cost insights, powered by OpenTelemetry.
Learn More
RedHat OpenShift Monitoring
Learn how Randoli can provide infrastructure & application monitoring for your OpenShift clusters.
Learn More
Dashboard depicting host monitors, application monitors, and various other host-related graphs. An AWS logo is in the bottom right corner of the image.
Amazon EKS Monitoring
Monitor your Amazon EKS environment with real-time performance and cost insights, powered by OpenTelemetry.
Learn More
Azure AKS Monitoring
Monitor your Azure AKS environment with real-time performance and cost insights, powered by OpenTelemetry.
Learn More
Google GKE Monitoring
Monitor your GKE environment with real-time performance and cost insights, powered by OpenTelemetry.
Learn More

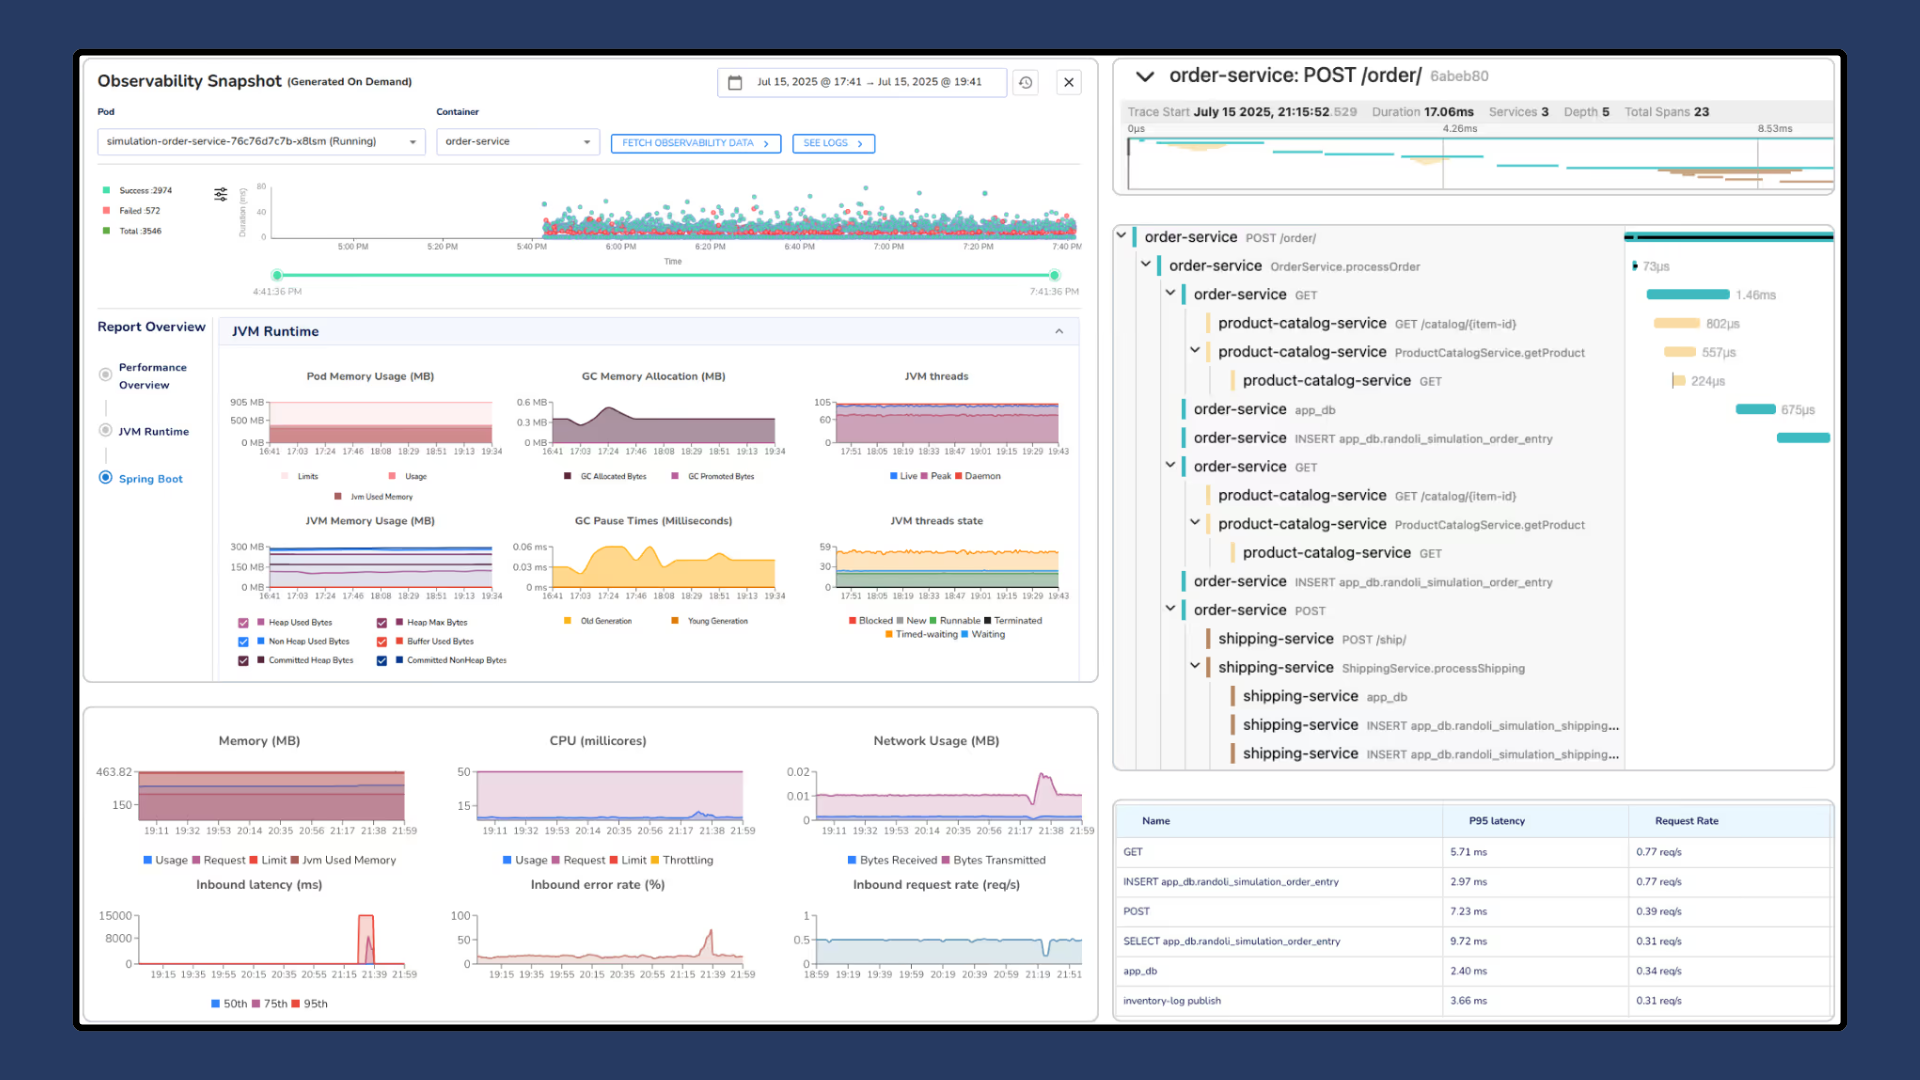
Explore Application Performance

Randoli helps you pinpoint and resolve application performance bottlenecks faster and with minimal setup, powered by OpenTelemetry-native instrumentation and intelligent diagnostics.

Application Performance Monitoring
Monitor your applications with real-time performance data, cost-effective on-demand telemetry, and proactive monitoring with contextual alerts, powered by OpenTelemetry.
Learn More
Streamline incident response with precise, actionable guidance.
Log Analysis & Monitoring
Automatically detect recurring issues directly from your application logs, with no data ever leaving your environment.
Learn More
Streamline incident response with precise, actionable guidance.
OpenTelemetry
Skip the complex setup, avoid vendor lock-in, and go live faster with prebuilt collectors, enriched pipelines, and automatic signal correlation.
Learn More

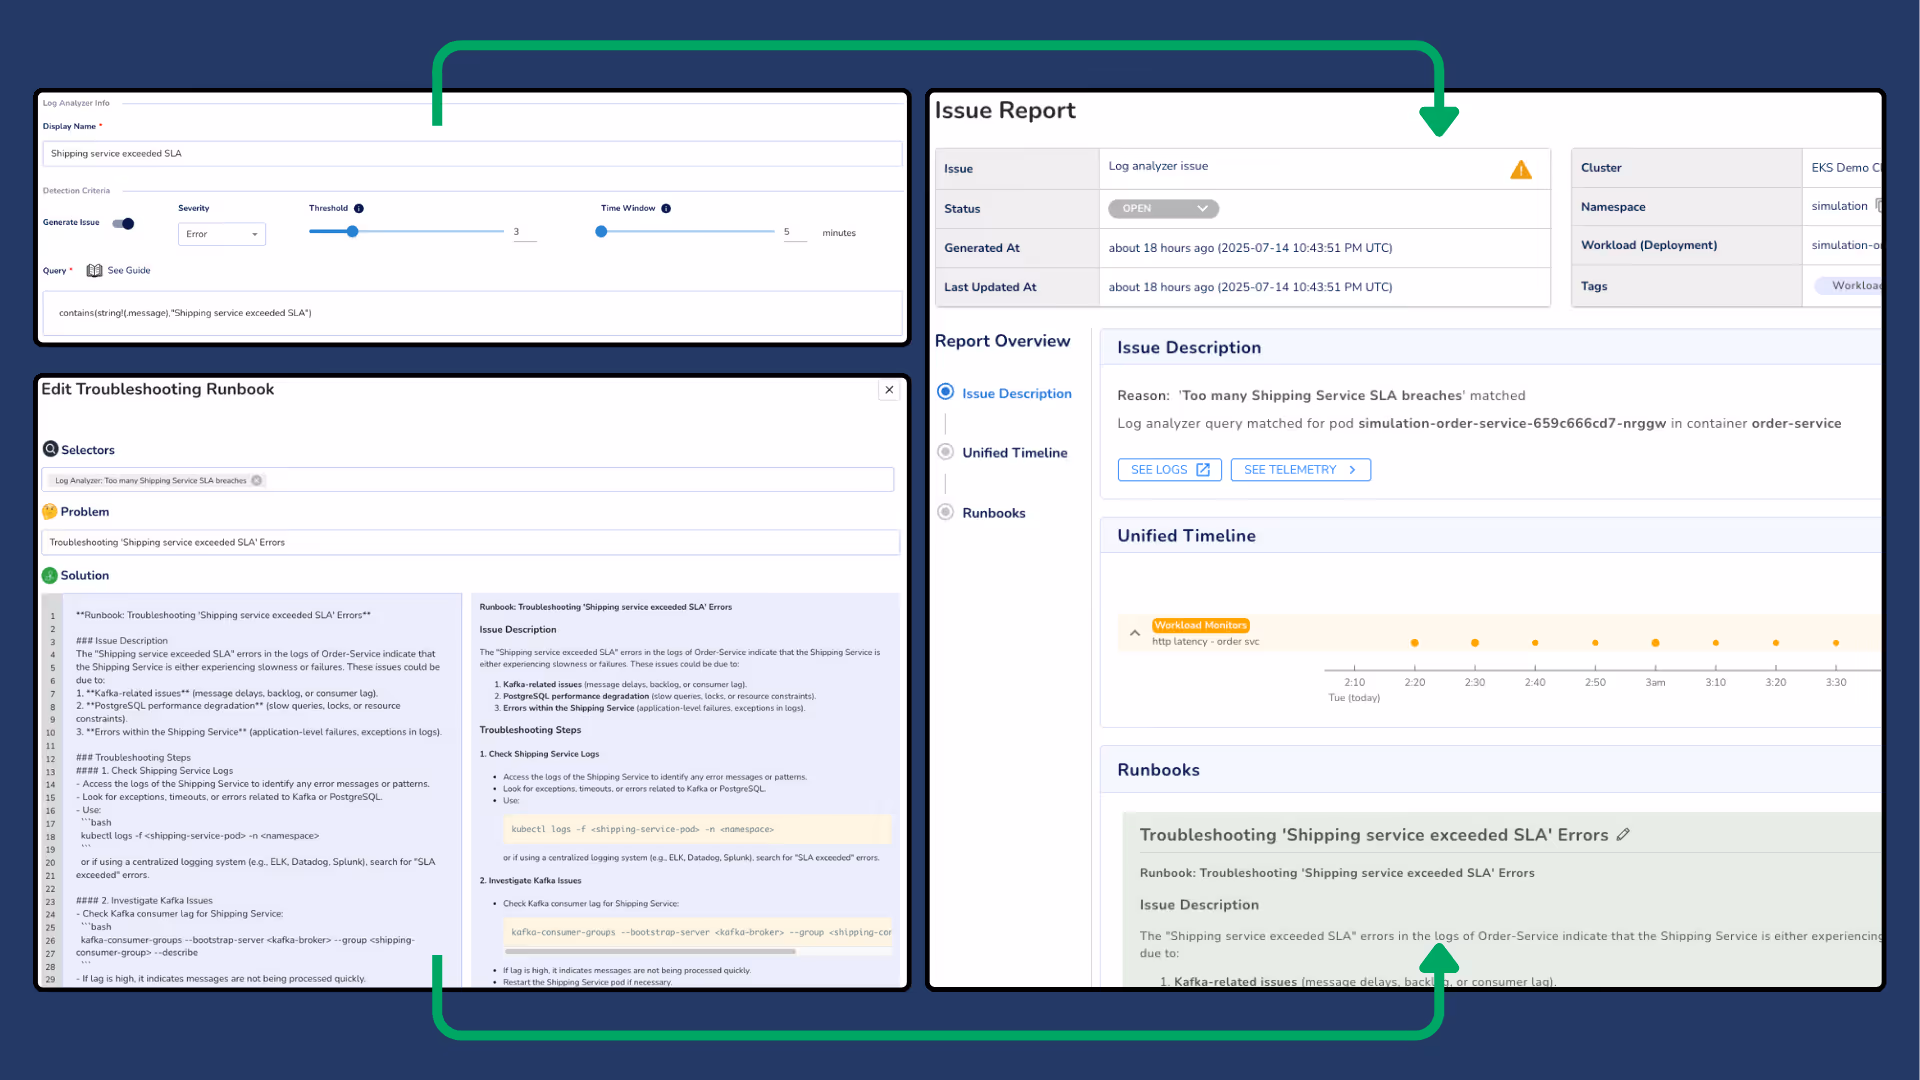
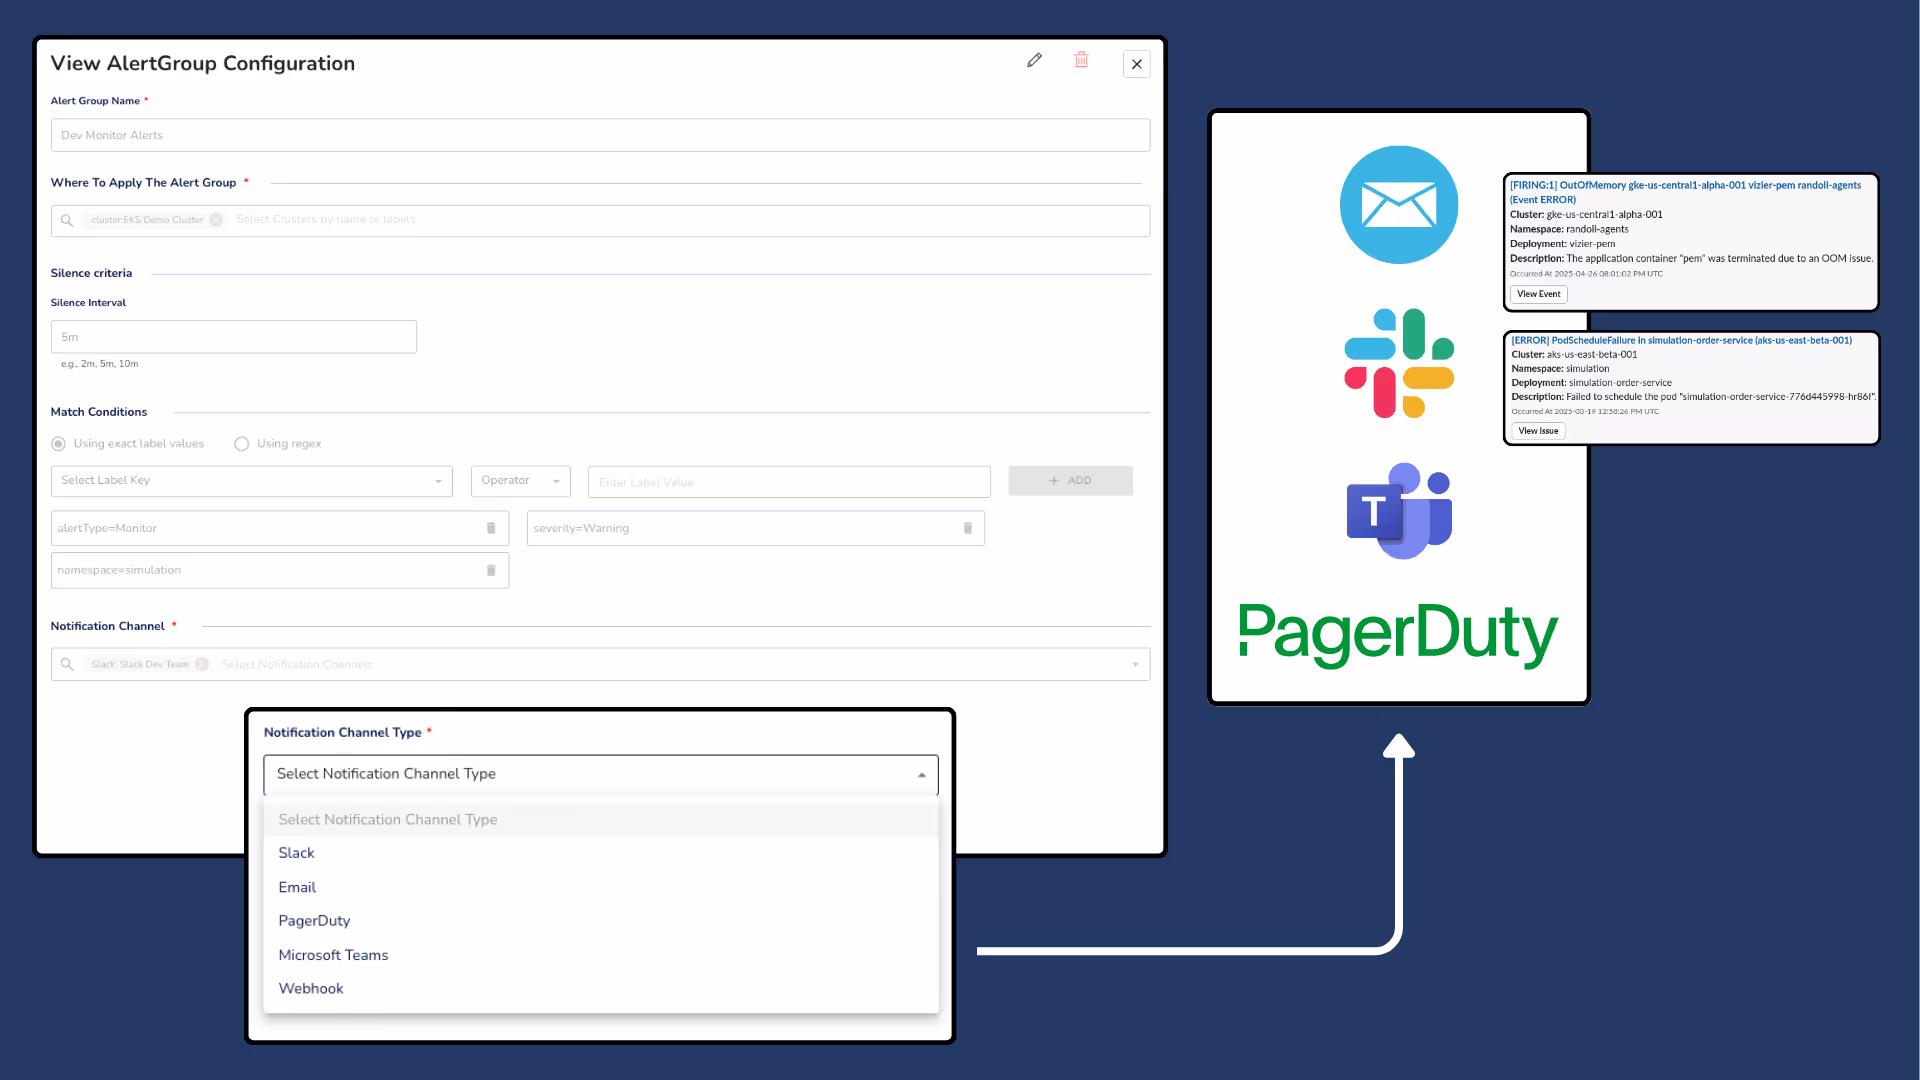
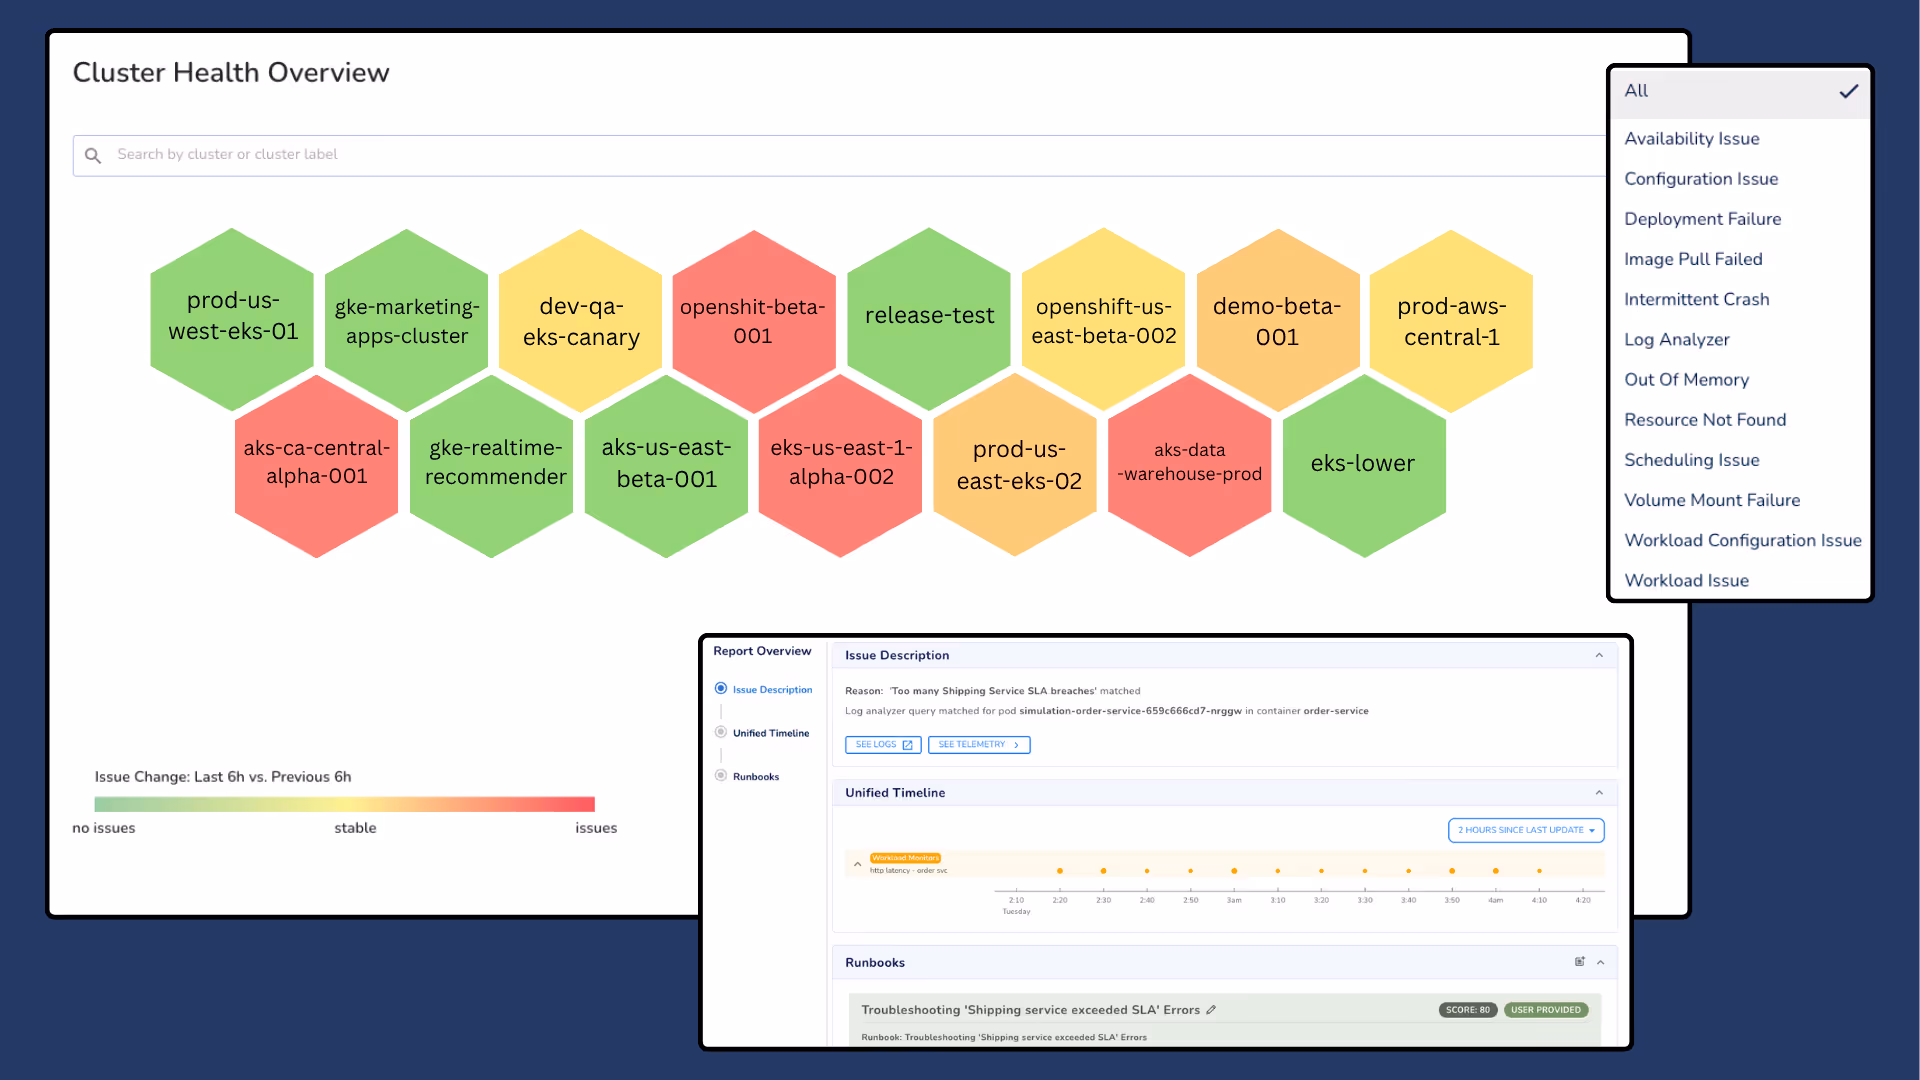
Explore Incident Management

Randoli streamlines incident management with automated runbooks, contextual alerts, and collaborative workflows to reduce MTTR.
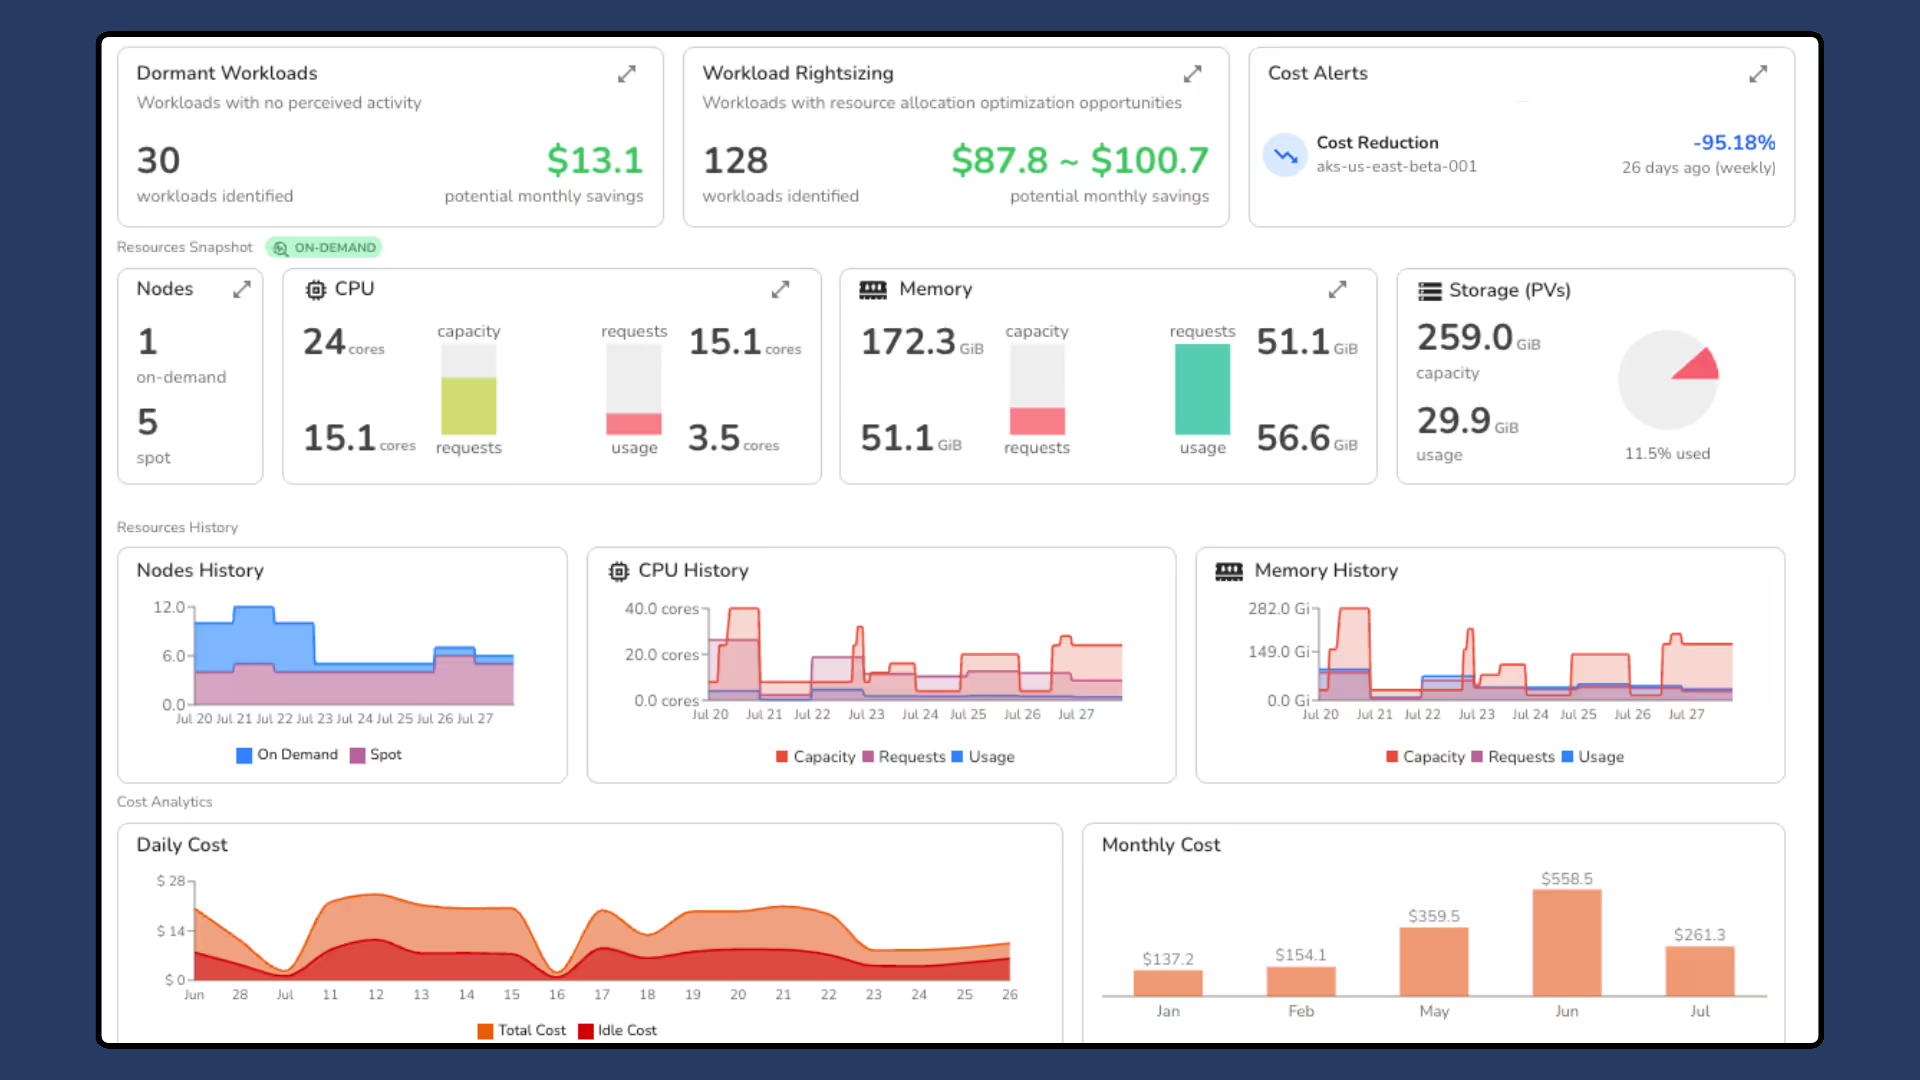
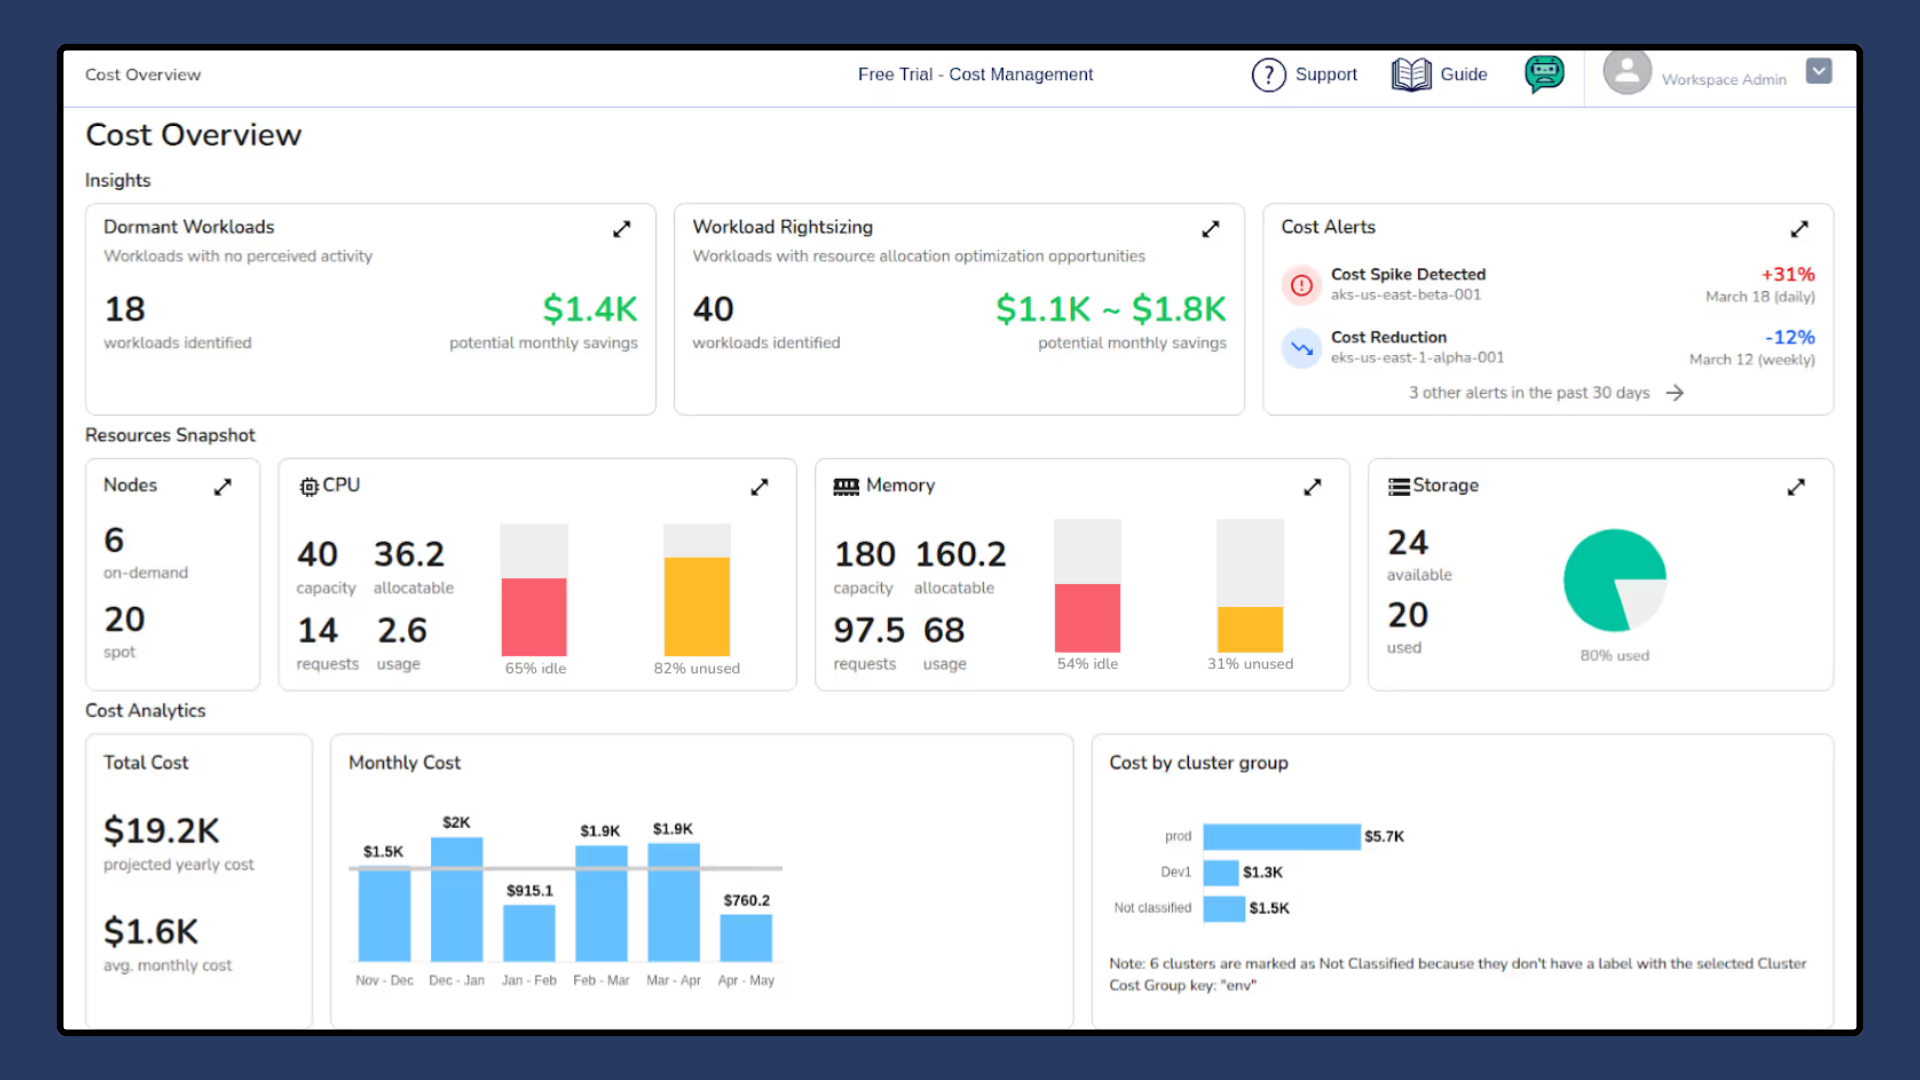
Screenshot showing Randoli AlertGroup configuration screen and link to workflow channel options, which include Email, Slack, Microsoft Teams, and PagerDuty. Also shows two example alerts.
Alert Management
Cut through the noise with intelligent alerting that drives faster incident response.
Learn More
Detect and resolve critical production issues faster with automatic issue detection, full-context telemetry, and guided resolution, purpose-built for distributed environments.
Contextual Incident Reports
Detect and resolve critical production issues faster with automatic issue detection, full-context telemetry, and guided resolution, purpose-built for distributed environments.
Learn More

Explore FinOps

Randoli gives you full visibility into Kubernetes costs, empowering FinOps teams to control budgets, reduce waste, and right-size clusters across any cloud.

A detailed dashboard showing metrics for dormant workloads, workload rightsizing, and cost alerts, as well as CPU, memory, and storage.
Kubernetes Cost Optimization
Reduce cloud waste and improve workload efficiency with data-driven cost optimization built for Kubernetes.
Learn More
Kubernetes Cost Monitoring
Monitor and understand your Kubernetes costs with real-time, actionable insights, built for engineers and FinOps teams to make smarter decisions faster.
Learn More

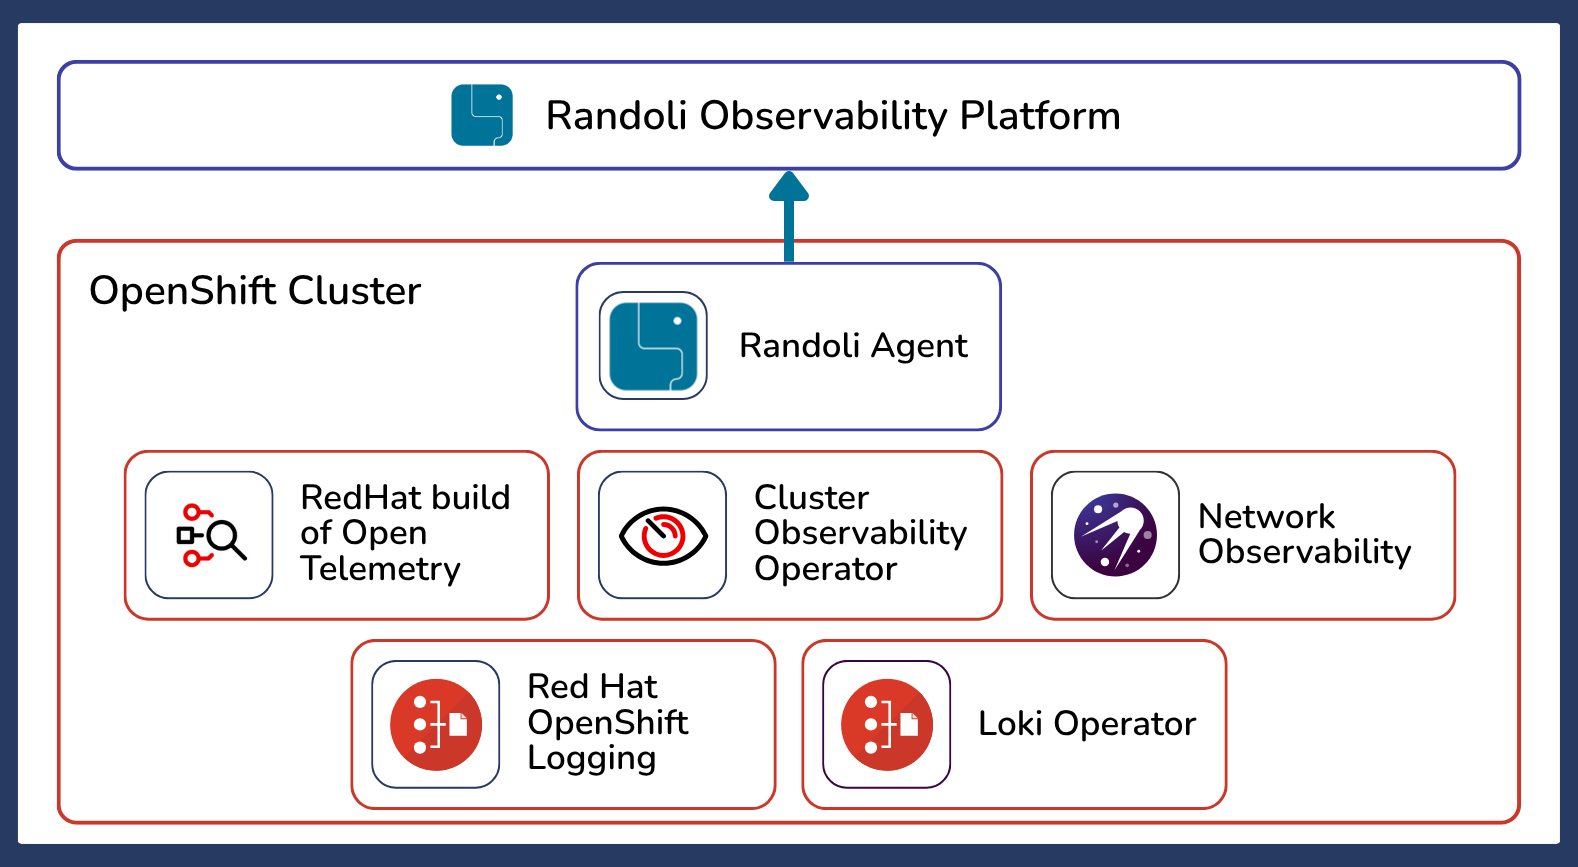
Explore Integrations

Randoli seamlessly integrates with your Kubernetes ecosystem, cloud platforms, and developer tools — aggregating metrics, logs, and traces into one OpenTelemetry-native platform.

Agentic AI
Randoli integrates with agentic AI workflows to analyze telemetry, trigger runbooks, and accelerate root cause resolution.
Learn More
Alerts
Randoli brings alerts into context with logs, metrics, and traces for clearer, actionable notifications.
Learn More
Cloud Cost APIs
Randoli correlates cloud billing data with Kubernetes usage for unified, real-time FinOps insights.
Learn More
Log Integration
Randoli integrates natively with log pipelines to deliver secure, in-cluster analysis without shipping data away.
Learn More
Metrics
Randoli aggregates metrics across infrastructure, apps, and services into one OpenTelemetry-native platform.
Learn More
Pipelines
Randoli connects telemetry with your CI/CD pipelines to spot regressions and performance issues early.
Learn More
SDKs
Instrument your apps with Randoli SDKs for complete OpenTelemetry coverage. Capture metrics, logs, and traces directly from your services with minimal effort.
Learn More
Technologies
Randoli makes it easy to bring telemetry from every layer into one platform.
Learn More
Traces
Randoli collects distributed traces with OpenTelemetry to follow requests across services and pinpoint bottlenecks.
Learn More