5 Reasons GenAI Costs Become Unpredictable in Production
February 4, 2026
Tags:
Cost Management
Generative AI
.png)
The cost of running GenAI often feels predictable in the early stages. A few experiments, a limited rollout, manageable bills. But once GenAI features move into production serving real users, powering multiple workflows, or running autonomous agents, costs start to behave differently.
Bills spike without obvious changes in traffic, Finance asks questions engineers struggle to answer, and traditional infrastructure or APM metrics offer little explanation. What looks like “unpredictable GenAI pricing” is usually a visibility problem that only surfaces at scale.
In this post, we’ll break down why GenAI costs become hard to reason about in production. We’ll walk through the most common challenges teams run into and explain the underlying reasons they occur. The goal is not to prescribe tools or solutions yet, but to clearly understand where cost visibility breaks down and why traditional monitoring approaches fall short once GenAI systems start operating at scale.
At a high level, GenAI costs don’t behave like traditional infrastructure or application costs.
They’re not driven by CPU usage, memory pressure, or request counts alone. Instead, they’re shaped by how applications interact with models: the prompts they generate, the responses they request, the workflows they trigger, and how often those interactions occur. Small changes in application behavior can significantly affect the usage and cost.
What makes this particularly challenging in production is that most of these cost drivers live outside the signals teams typically monitor. Model usage is abstracted behind APIs, token consumption is rarely visible at runtime, and GenAI spend is often shared across multiple services or teams. As systems scale, this lack of visibility compounds, making it difficult to answer basic questions about where cost is coming from, who owns it, and why it’s changing.
The challenges below are patterns we see repeatedly once GenAI workloads operate at scale.
In production systems, GenAI usage rarely flows through a single model. Teams experiment with different providers, switch between model versions, or route requests dynamically based on use case. Over time, what starts as a deliberate choice turns into a mix of models powering different parts of the application, often without a clear picture of how much each one actually costs.
From a cost perspective, this creates an immediate blind spot. Every GenAI provider price models differently, and even small differences in input or output token pricing can have a meaningful impact at scale. When usage is aggregated at the account or provider level, teams lose the ability to answer a basic question: which models are actually responsible for the bulk of our spend?
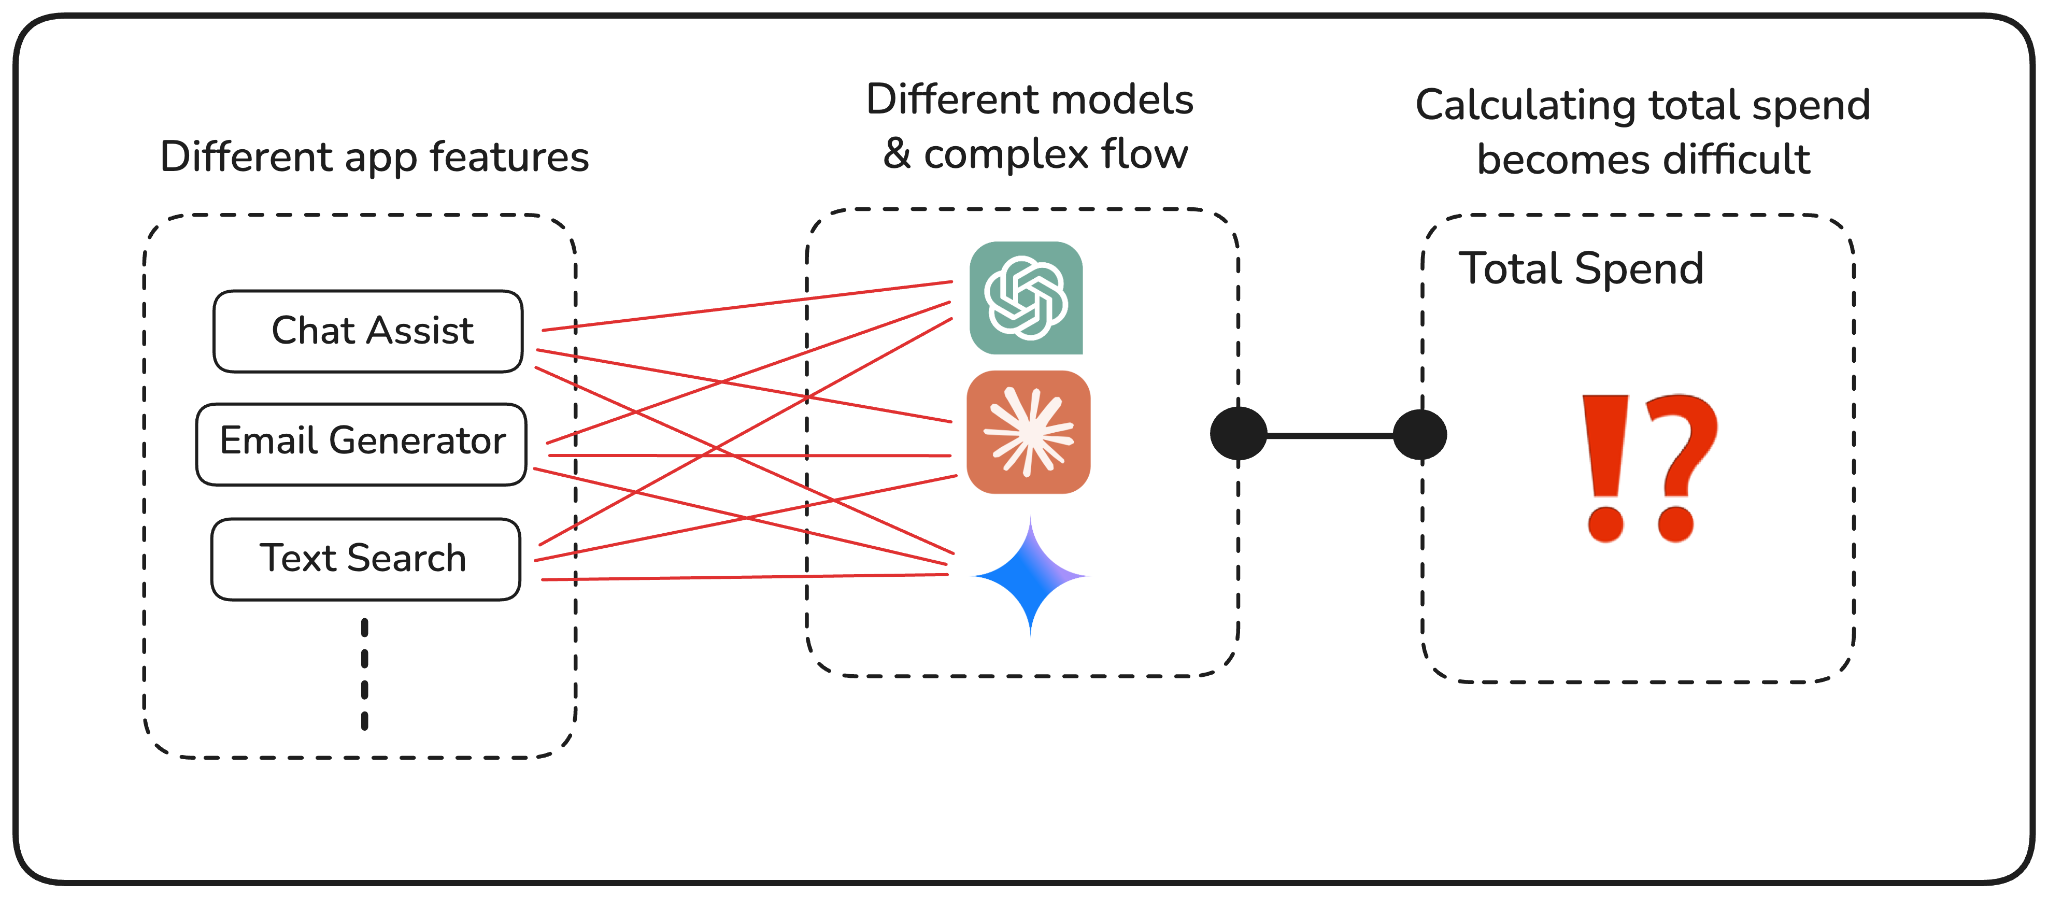
This becomes especially painful when costs increase. Finance might see a sudden jump in the monthly bill and ask whether a particular model or feature is responsible. Engineers, on the other hand, may know which models are in use, but lack visibility into how usage and cost break down across them. Without that connection, optimization turns into guesswork. Teams debate model choices without clear data to back decisions.
What makes this challenge harder is that model usage often changes over time in subtle ways. A newer model version might be rolled out gradually. A routing rule might favor a more expensive model under certain conditions. These shifts don’t always show up in traffic metrics, but they can materially affect cost. By the time teams notice the impact, the underlying usage pattern has often been in place for weeks.
In most production systems, application teams don't see token usage the same way they see CPU, memory, or API latency. There’s no built-in dashboard that shows which route or feature triggered how many input or output tokens. And because GenAI calls are often made through third-party SDKs or abstracted libraries, they don’t show up clearly in logs or traces either.
This makes it surprisingly difficult to connect application behavior to cost.
Consider this: A developer ships a new prompt variation or routes requests through a different agent chain, and suddenly token usage doubles, but no one notices. The product team might be running A/B tests, or an ML pipeline might include multiple retries and fallback prompts. Unless someone’s explicitly measuring token flow at the app layer, these patterns remain invisible.
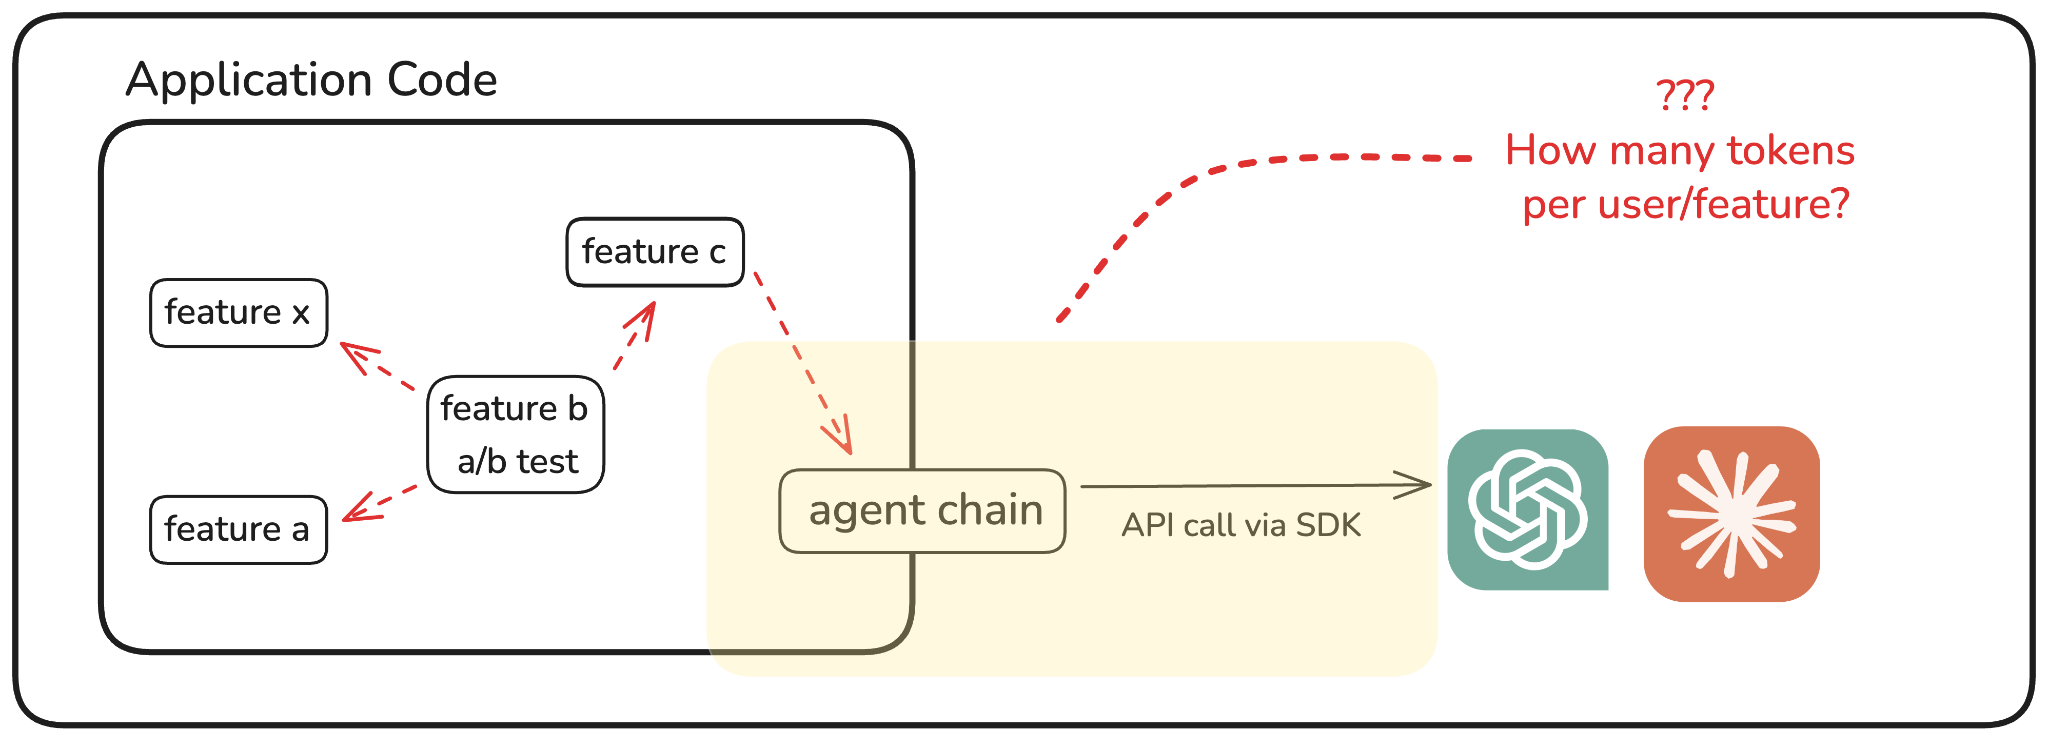
From a cost standpoint, this creates a significant blind spot. Token usage is the unit that drives GenAI billing. If you can’t measure token consumption at the point where it originates, which is inside your application logic, you can’t predict or explain cost. You might know that a particular service is using OpenAI or Anthropic, but not how much each feature, user cohort, or prompt variant is consuming.
Over time, this disconnect accumulates. Engineering teams operate the app, Finance monitors the bills, but neither has a clear line of sight into how usage patterns map to spend.
Without visibility into tokens at the application level, it’s almost impossible to reason about cost drivers or plan budgets effectively.
Even when teams have access to model-level usage or cost data, the next question is often harder to answer: where did that usage actually come from? In most cases, it’s not tied back to how the model was used, or where in the stack the request originated.
Was it a backend API? A cron job? A specific user flow in the product? Most GenAI billing is tagged at the cloud account or API key level, which doesn’t tell you which service, environment, or workload drove that cost.
This gap becomes critical in production. Without application-level attribution, it's hard to prioritize optimization work. A FinOps team may see that a particular model is responsible for a $4K spend this week, but without knowing which services are calling it (and how often), there’s no easy way to assess tradeoffs or guide engineering effort. Should the team invest time in caching responses? Should they switch models? Should they restrict usage in staging or internal tools? None of those calls can be made confidently without workload-level context.
From the engineer’s side, this disconnect creates friction too. Logs might show that the app is hitting the model endpoint, but tying that usage to actual cost still may require switching tools. Sometimes the only clue is a vague billing tag or an internal convention in API key naming. In larger orgs, this quickly turns into a scavenger hunt.
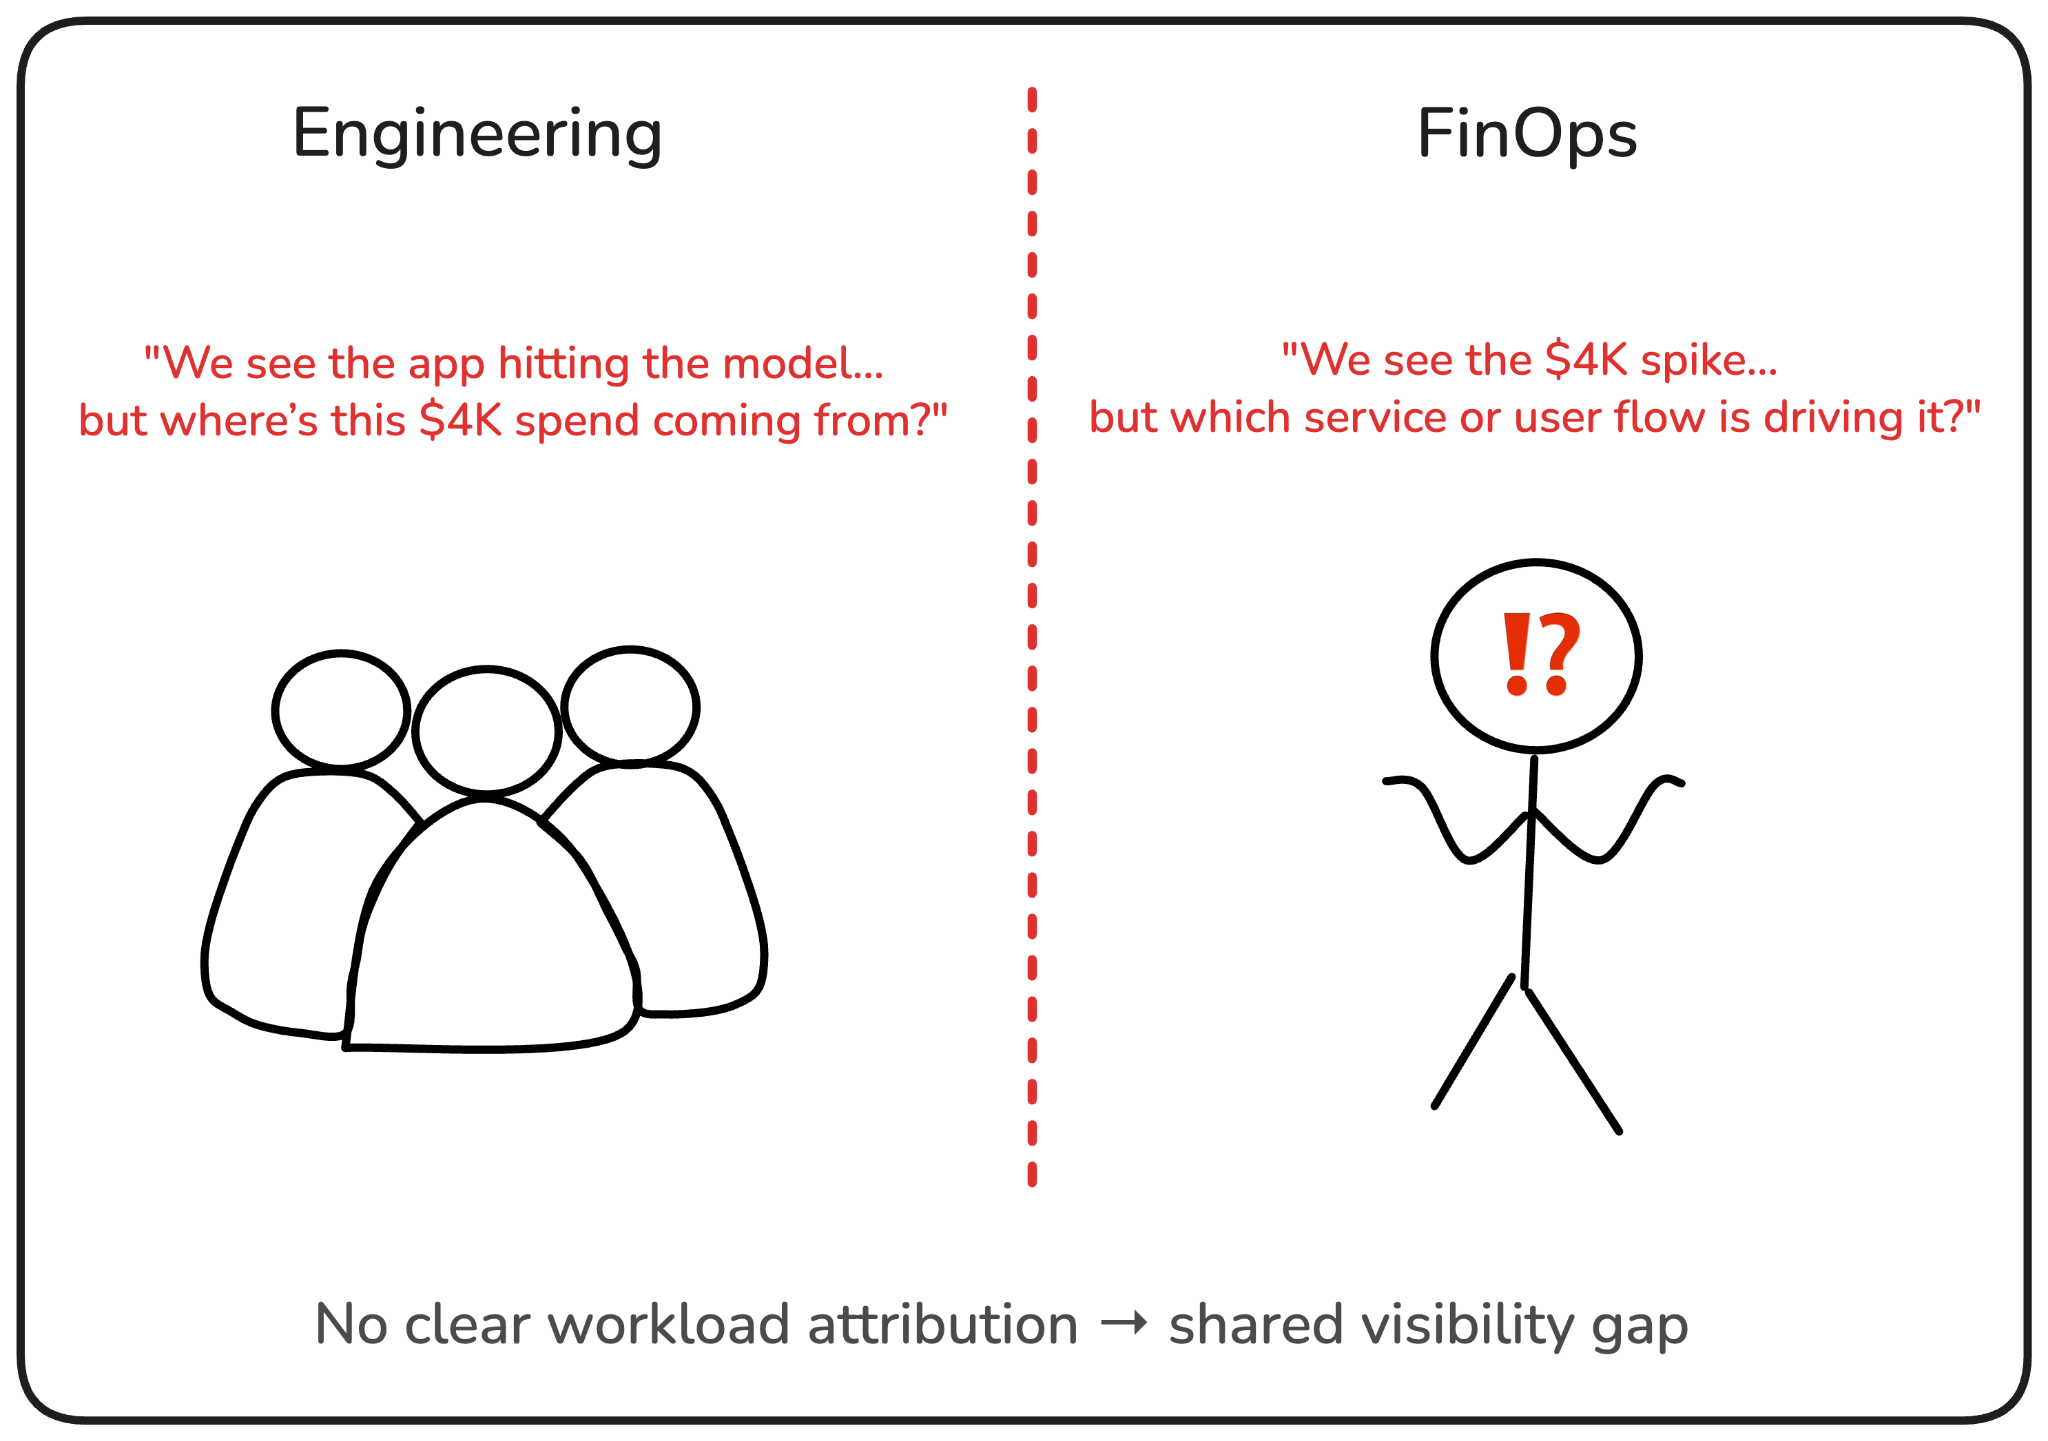
Note: This isn’t just a FinOps problem, it’s a shared visibility problem. Engineers want to write more efficient code. Finance wants cost predictability. But neither can act without workload attribution.
In traditional infra monitoring, you'd tag metrics by service, environment, and deployment. That kind of breakdown is what makes dashboards and alerts useful. But GenAI usage flows through a different pipeline, often outside logs, metrics, and traces, so those tags get lost.
The result: no one has a full picture of where GenAI spend is coming from. Which means no one can confidently drive it down.
GenAI systems often accumulate costs gradually, until they may not. What may start as a slow J-curve can suddenly turn into a sharp spike, catching both engineering and finance teams off guard. The issue isn’t just that the cost increases, but that teams usually find out too late, after the bill has already landed.
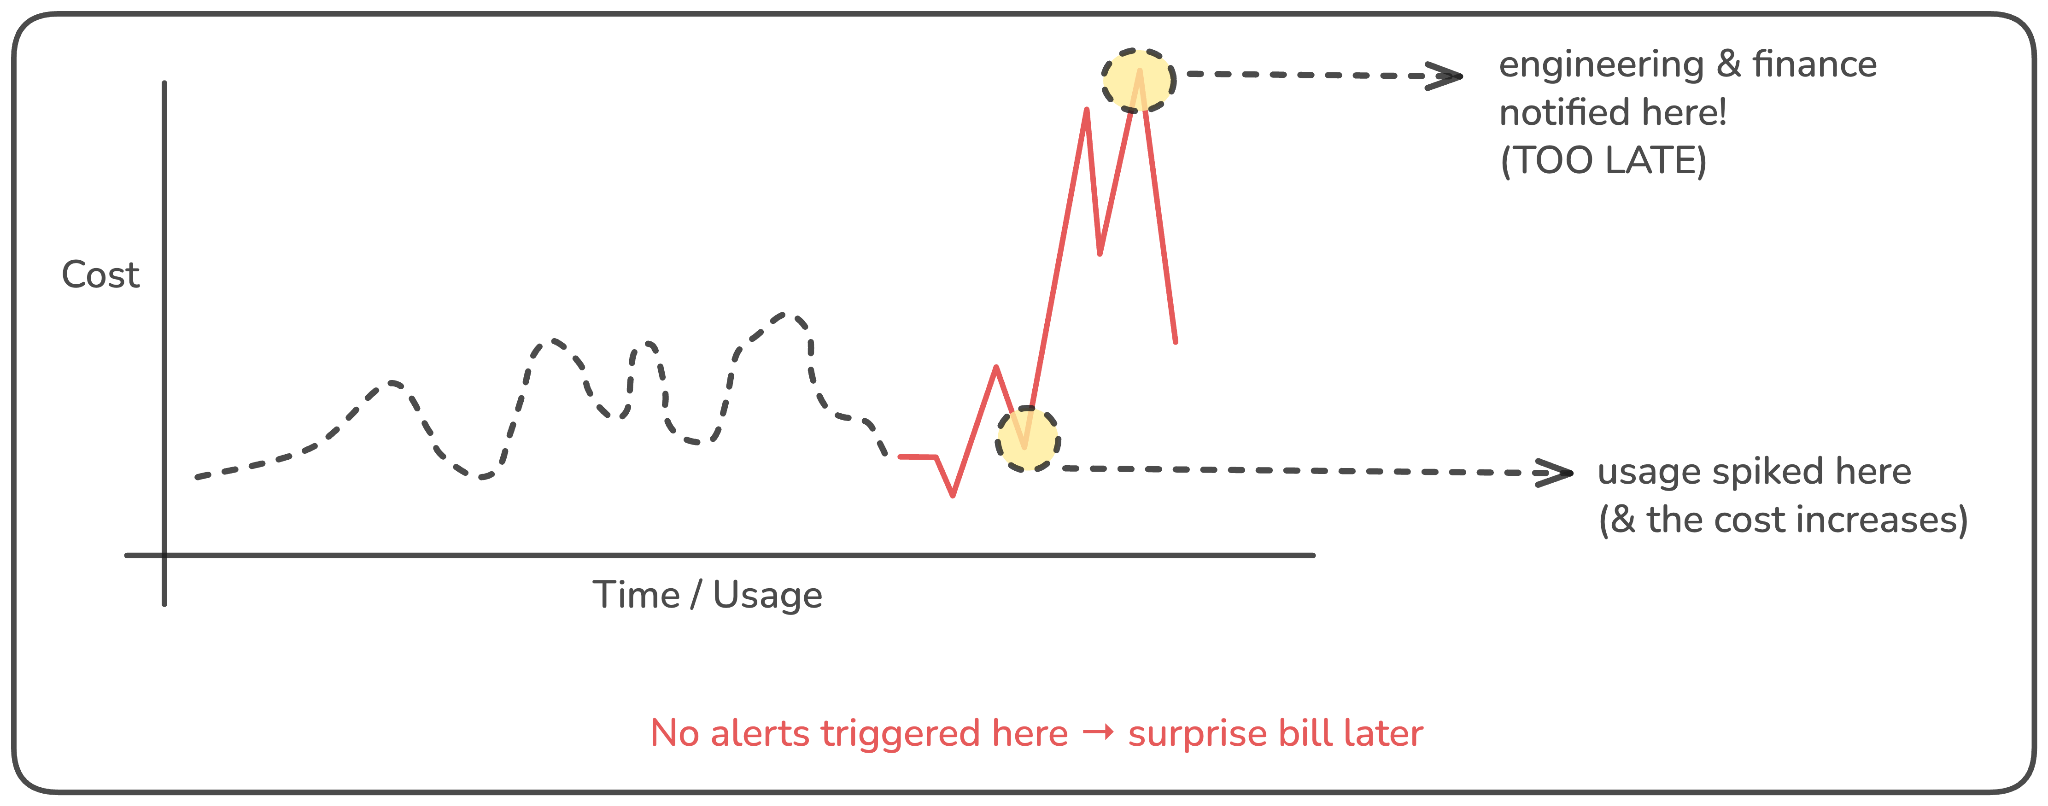
By the time a spike is visible in billing dashboards, the usage pattern that caused it may be days or even weeks old. Was it a new prompt structure? A model config change? A surge in retries from downstream failures? It’s hard to tell, especially when the system didn’t emit any alerts at the moment the usage increased.
The challenge here is one of latency in feedback. Most teams don’t have a “cost budget” per feature, workflow, or service, and billing data from providers is delayed by design. This creates a reactive loop: cost spikes first, then investigation begins, and only later does optimization happen, assuming teams can even identify the root cause.
This is especially painful in high-throughput workloads. A small increase in tokens per request, when multiplied across thousands of requests per minute, can have a disproportionate financial impact. But without proactive signals tied to real-time usage, teams are stuck in a post-mortem cycle, optimizing yesterday’s problem with today’s guesswork.
One of the biggest reasons GenAI costs catch teams off guard is because they’re simply not part of the existing observability setup.
You might have detailed dashboards for CPU and memory usage, metrics pipelines tracking request latency and error rates, even traces that follow user flows across services. But none of those signals include token usage, model decisions, or prompt behavior, the core factors driving GenAI spend.
That’s because GenAI usage doesn’t fit neatly into traditional monitoring categories. It’s not infrastructure-level. It’s not application performance in the usual sense. It’s somewhere in between, an operational layer that sits inside application logic but depends heavily on external APIs. And most existing observability solutions just weren’t built with this layer in mind.
For FinOps teams, this means GenAI spend often feels like a separate black box, disconnected from unit cost metrics, allocation models, or forecasting tools. For engineers, it means debugging or optimizing LLM usage becomes a context switch, jumping between billing portals, app logs, and whatever traces happen to exist. There's no unified way to ask, “Why did our GenAI cost go up last week?” and get a clear, trustworthy answer.
This is the root cause that ties all the previous challenges together. Model-level cost visibility, token usage, workload attribution, and proactive alerts all require observability that actually understands GenAI as a workload, not just as an API call. And until that becomes part of the standard monitoring toolkit, cost unpredictability will remain the default.
The unpredictable nature of GenAI costs isn’t just a byproduct of how LLMs are priced, it’s a result of missing visibility at every layer.
From model selection and token usage to workload attribution and spike detection, most teams are running GenAI workloads without the kinds of signals they’d never go without in traditional infra or application monitoring.
These challenges don’t surface all at once. They show up gradually as usage grows, features evolve, or teams scale up, and by the time they become visible in billing reports, it’s often too late to act without pain (and the cost that comes with it).
In the next post, we’ll talk about what teams can actually do to close these visibility gaps: which signals to collect, what to monitor, and how to design telemetry that helps both engineering and FinOps teams stay ahead of spend, before the next spike hits.
.png)
.png)


