LLM Observability
Monitor cost, latency, and reliability of your LLM applications, without adding a separate stack or agent.

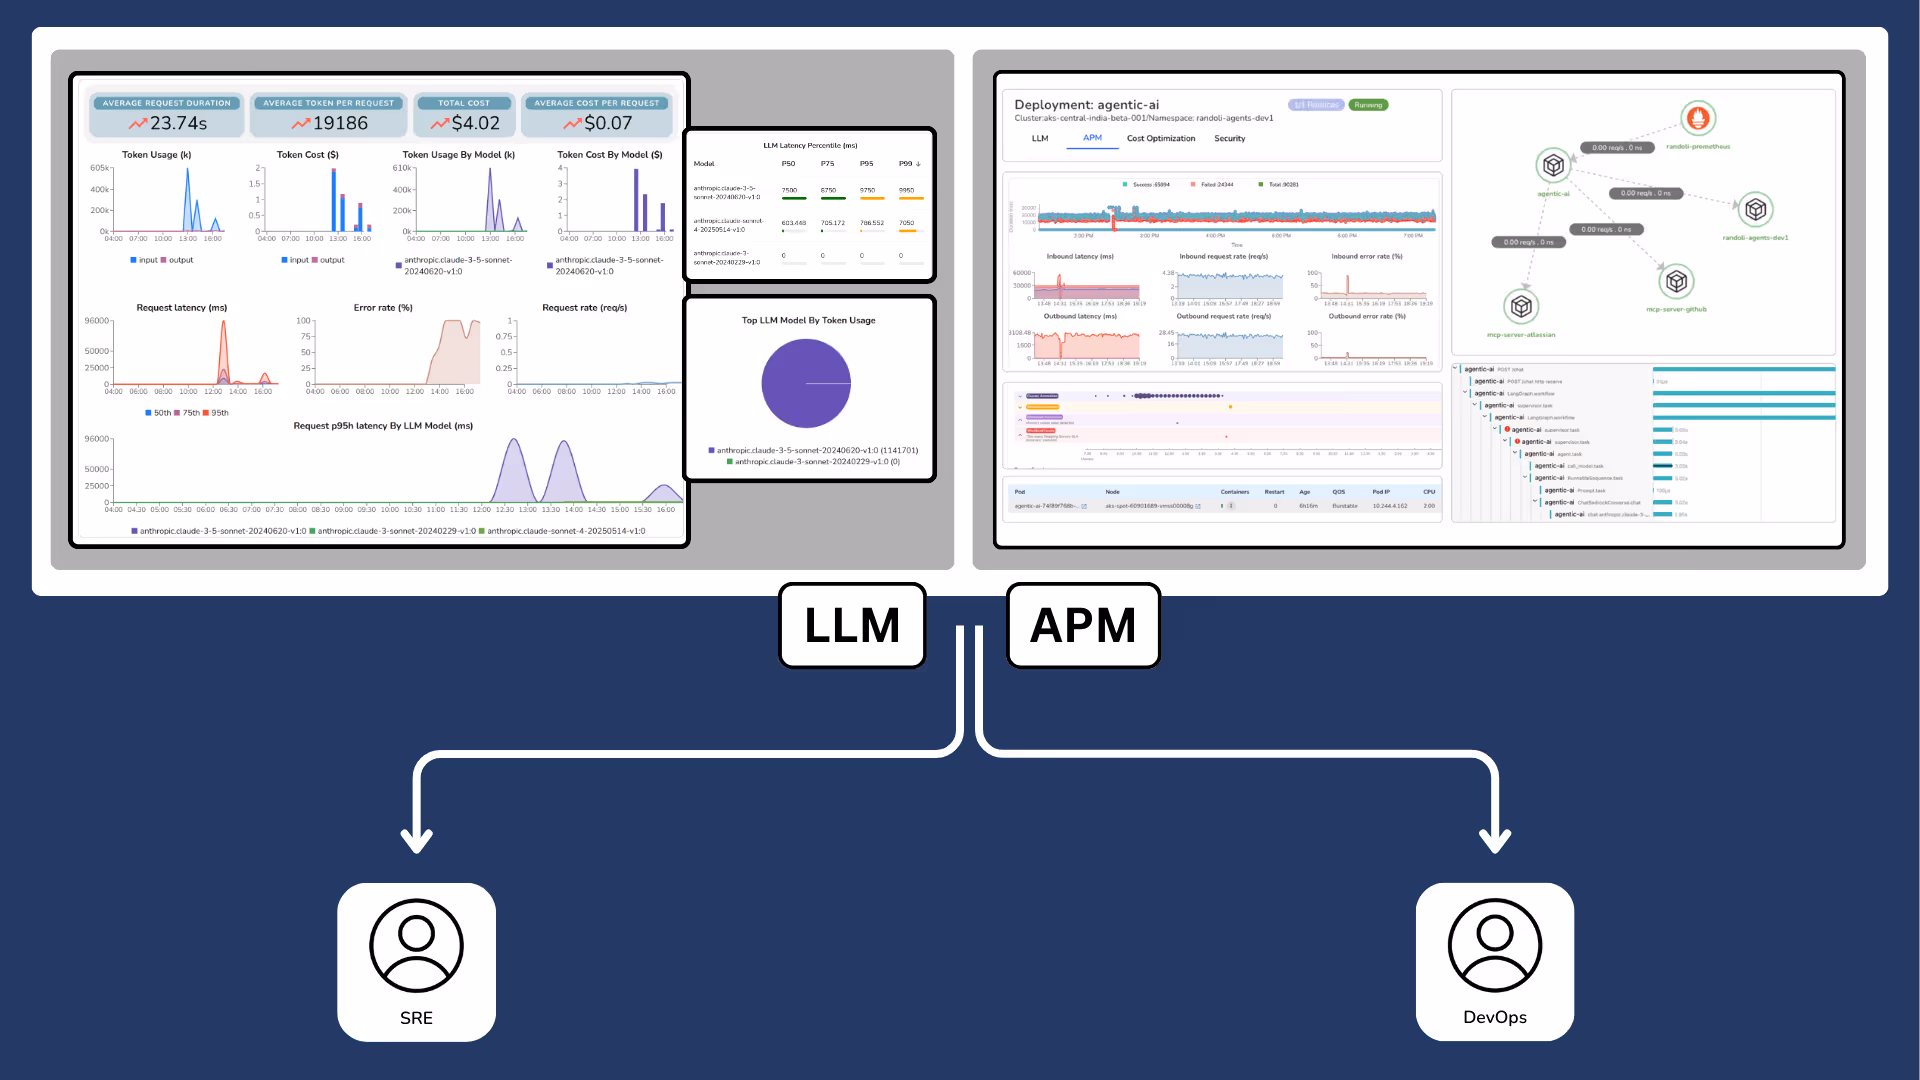
Unified LLM & Infrastructure Observability
Per-Model Performance & Cost Insights
Plug-and-Play Provider Support
Unified LLM & Infrastructure Observability
Per-Model Performance & Cost Insights
Plug-and-Play Provider Support
.png)
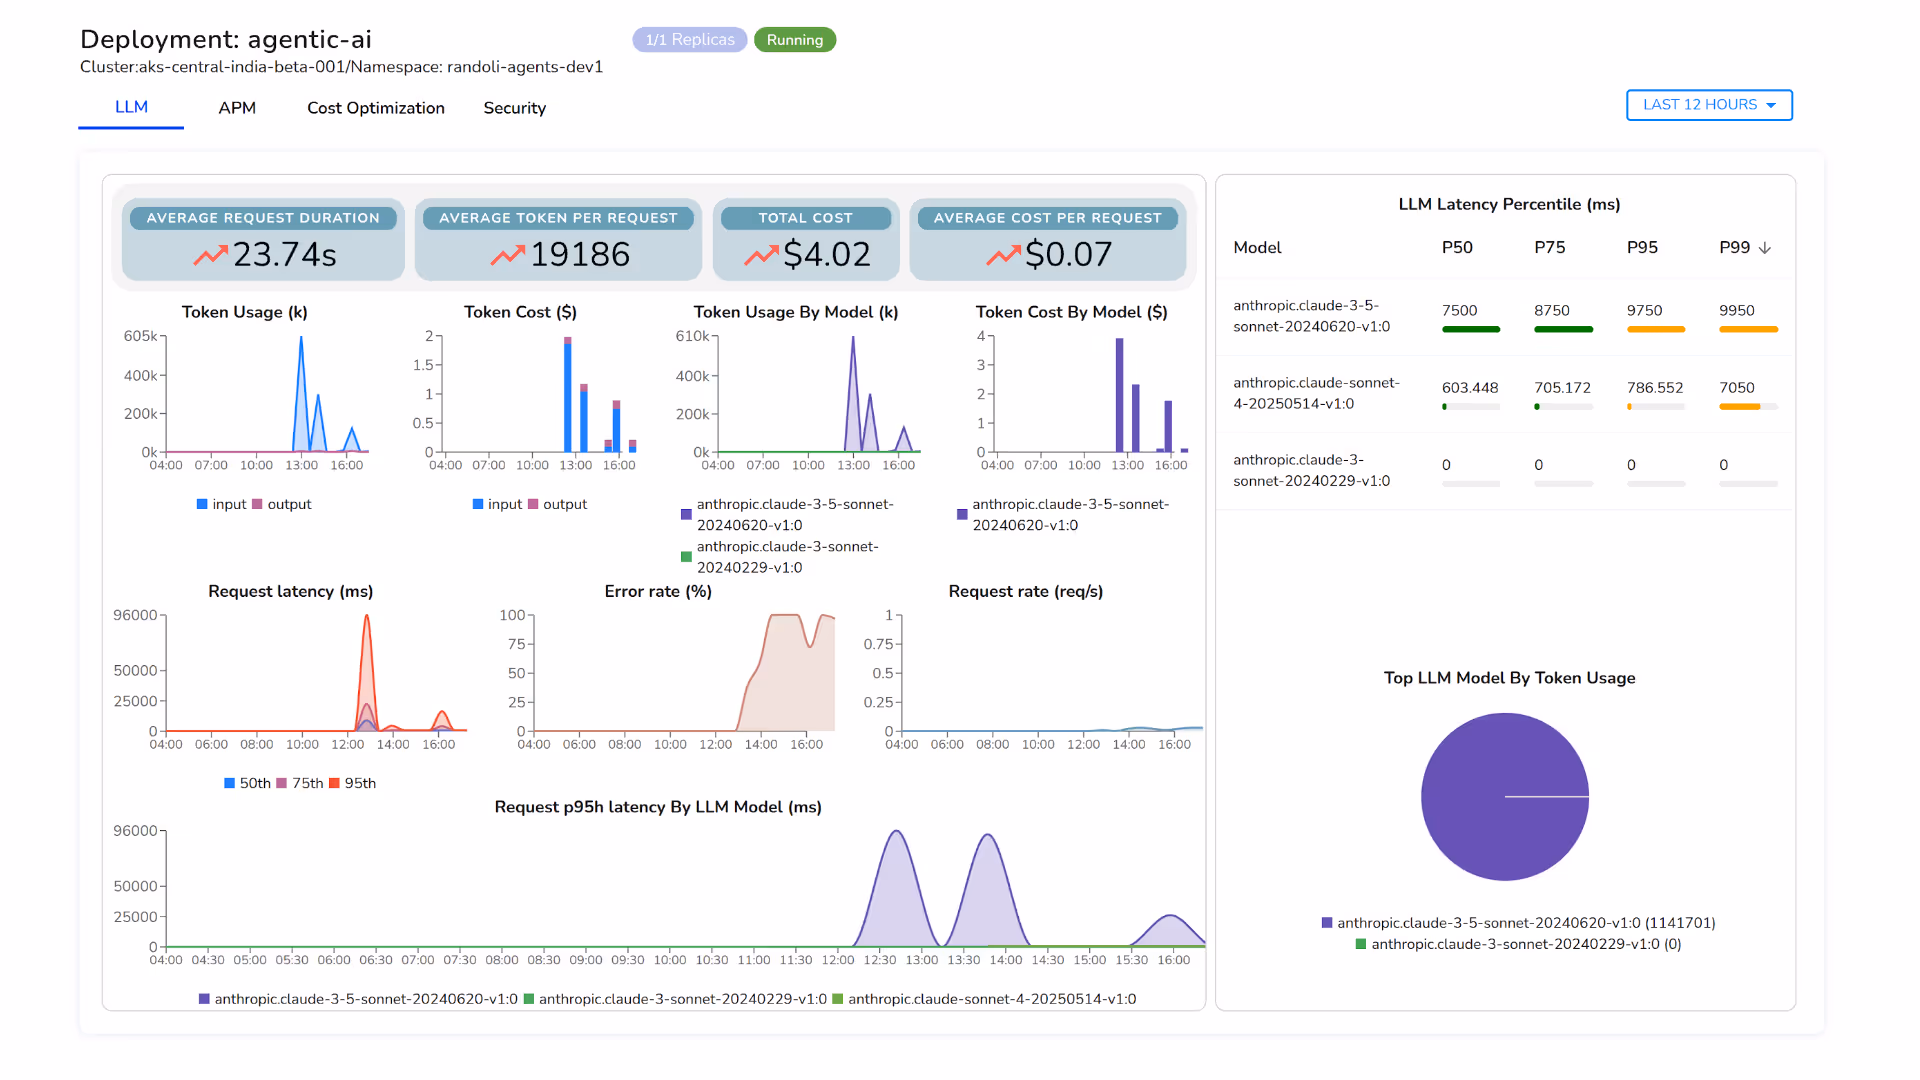
Monitor LLM behavior and application performance in a single, correlated view.

View model-level usage, latency, and token breakdowns
Analyze app-level metrics like request rates and system errors
Trace end-to-end performance across LLM and infrastructure layers

Break down cost, latency, and reliability metrics by LLM model.
Track request duration, error rates, and token usage per model
Compare latency percentiles (P50–P99) across providers
Detect cost spikes or failures at the model level
Get started instantly with built-in support for popular providers.
Works out-of-the-box with OpenAI, Claude, HuggingFace, Llama, and more
OpenTelemetry-native, no vendor lock-in
Seamlessly integrates with your existing observability stack

At Randoli, our customers are our number one priority. We collaborate with our customers & open source communities to find innovative solutions to pain points and challenges. This is the secret behind the success of our Observability & Cost Management solutions.