Best Practices for Log Monitoring in Production
February 12, 2026
Tags:
Observability
OpenTelemetry
Log Monitoring
.png)
In production, organizations discover the hard way that collecting logs is easy but extracting actionable insight from them is not. Log volume quickly grows faster than signal, context is lost, and slow or costly searches force engineers to filter noise instead of understanding failures. As seen in the previous blog, these issues show up repeatedly in real outages, where logs exist but fail to provide clear answers when time matters most.
This blog focuses on what good log monitoring looks like in practice and how it addresses those gaps. We’ll explore how modern log monitoring differs from traditional approaches, how to capture the right data, and the core principles that make logs useful in production.
As systems scale, traditional logging practices were not being effective in production. What works for a small number of services quickly breaks down in distributed environments, where failures span multiple components and engineers need fast, reliable insight during incidents.
The difference is not just tooling, but how logs are designed, structured, correlated, and used operationally. Modern logging treats logs as first-class production signals, not just debugging output. Few key differences that actually matters in production are shown below -
Before we were recording events in isolation, forcing engineers to manually connect logs across services. Modern logging practices embed request, trace, and service context directly into logs, making it possible to follow failures end-to-end across distributed systems.
Plain-text logs are readable but difficult to search at scale. Modern logging relies on structured data, allowing fast filtering, aggregation, and analysis during incidents.
Beforehand systems often tie cost directly to log volume, pushing teams to reduce retention or logging depth. Modern systems separate retention from indexing, allowing teams to keep logs for investigation while selectively indexing only high-value fields.
Traditionally logging depends on manual searches and intuition. Modern logging practices are designed for quick queries and faster root-cause identification under production pressure.
Below is a side-by-side comparison that highlights how the current logging ways and modern logging practices differ across the dimensions that matter most in production operations.
These differences explain why the current logging system fails at scale and why modern log monitoring practices are essential for reliable production operations.
With that context, we now focus on designing strong signals, adding meaningful context, and making logs easy to query and visualize during incidents.
These pillars represent the minimum design requirements for logs to function as reliable operational signals in distributed systems.
As systems scale, logging everything by default overwhelms teams with noise, making real failures harder to find when incidents occur. Designing logs for signal quality prioritizes intentional, high-value events over exhaustive execution traces.
Effective logging focuses on operationally meaningful events - entry and exit points, failures, state changes, threshold breaches, and abnormal dependency behavior. By logging fewer but more intentional events, teams dramatically improve signal-to-noise ratio during investigations.
Once logs are treated as signals, severity levels become the primary way to express operational intent:
ERROR - confirmed service failures that require investigation
WARN - abnormal conditions that may escalate if ignored
INFO - business-relevant events, not internal chatter
DEBUG - high-detail diagnostics, gated or sampled in production
Clear and consistent severity definitions allow engineers to filter, prioritize, and act quickly under incident pressure
Without context or correlation, logs appear as isolated events, making it difficult to determine which requests failed, who was impacted, or how issues propagate across services. In distributed systems, this forces engineers to chase symptoms across logs, metrics, and services without a clear starting point.
Enriching logs with context turns individual log lines into a coherent record of how a request moved through the system.
Contextual enrichment adds meaning to logs by attaching identifiers and metadata that describe where the event occurred and what it affected. When logs consistently include trace IDs, request IDs, service names, and business context, they become searchable, correlatable, and actionable especially in distributed systems.
Key Context Fields Every Log Should Include :
1. Well-enriched logs share a common set of structured fields that enable fast investigation and cross-service correlation:
2. Correlating logs with metrics and traces bridges this gap. Metrics provide high-level alerts, traces show the end-to-end path of requests, and logs reveal detailed events within that path.
Practical Tips :
Includetrace_idandrequest_idin all logs for correlation
Link logs to real-time metrics dashboards for anomaly detection
Use tracing tools to map the journey of each request across services
This unified enrichment of logs with context and correlated with traces and metrics, they stop being raw output and enable engineers to identify root causes quickly, even under real production pressure.
When logs live on individual hosts or services, visibility fragments quickly. Engineers are forced to manually jump between systems, correlate timestamps by hand, and guess how failures propagate across services.
Unified Log Aggregation and structuring logs ensures that operational data remains usable as systems and teams scale.
Centralized log aggregation brings all logs into a single platform with consistent formatting and shared context. When logs are structured and ingested centrally, teams can analyze failures end-to-end instead of service by service.
A scalable log aggregation setup should:
Ingest structured logs (such as JSON) consistently across servicesScale horizontally to handle traffic growth without query degradationNormalize and enrich logs at ingestion to ensure consistent fieldsStructured logs are the foundation that enables fast parsing, reliable filtering, and correlation across distributed systems.
In many systems, logs technically exist but are painfully slow to search. Free-text scans across massive volumes turn investigations into guesswork, discouraging teams from using logs when they matter most.
Logs only deliver value when engineers can query them quickly under real operational pressure like making “Query as an Operational Primitive”
Effective log monitoring treats querying as a first-class capability. Logs must be structured so queries operate on indexed fields rather than raw text, allowing teams to isolate failures in seconds instead of minutes.
Effective querying depends on:
When logs are fast and queryable, they become an investigative asset. When they aren’t, they become an expensive archive that engineers avoid during incidents .
In production, individual log entries rarely tell the full story. A single error may be transient, but repeated occurrences of the same condition often signal a systemic issue. Effective log monitoring shifts the focus from “what happened once?” to “what is happening repeatedly, where, and how fast is it escalating?” By aggregating related events and highlighting frequency and clustering, teams can detect emerging incidents earlier.
Consider a common example in JVM-based services. A single “out of allocated memory” log entry may appear transient and easy to dismiss. However, when the same OOM condition is detected multiple times within a short window, say, five occurrences within ten minutes, it is rarely an isolated failure. Patterns like this typically indicate sustained memory pressure, misconfigured resource limits, or a memory leak that worsens under load.
The example below shows an automatically generated issue report in Randoli, after the system detected this recurring pattern. Multiple JVM OOM logs were clustered into a single actionable signal, uncovering a memory leak in a newly deployed service version that quickly exhausted its 80 MB JVM allocation. What appeared as isolated crashes was in fact sustained memory pressure, driving repeated OOM failures, increased latency, and HTTP 500 errors across multiple endpoints.
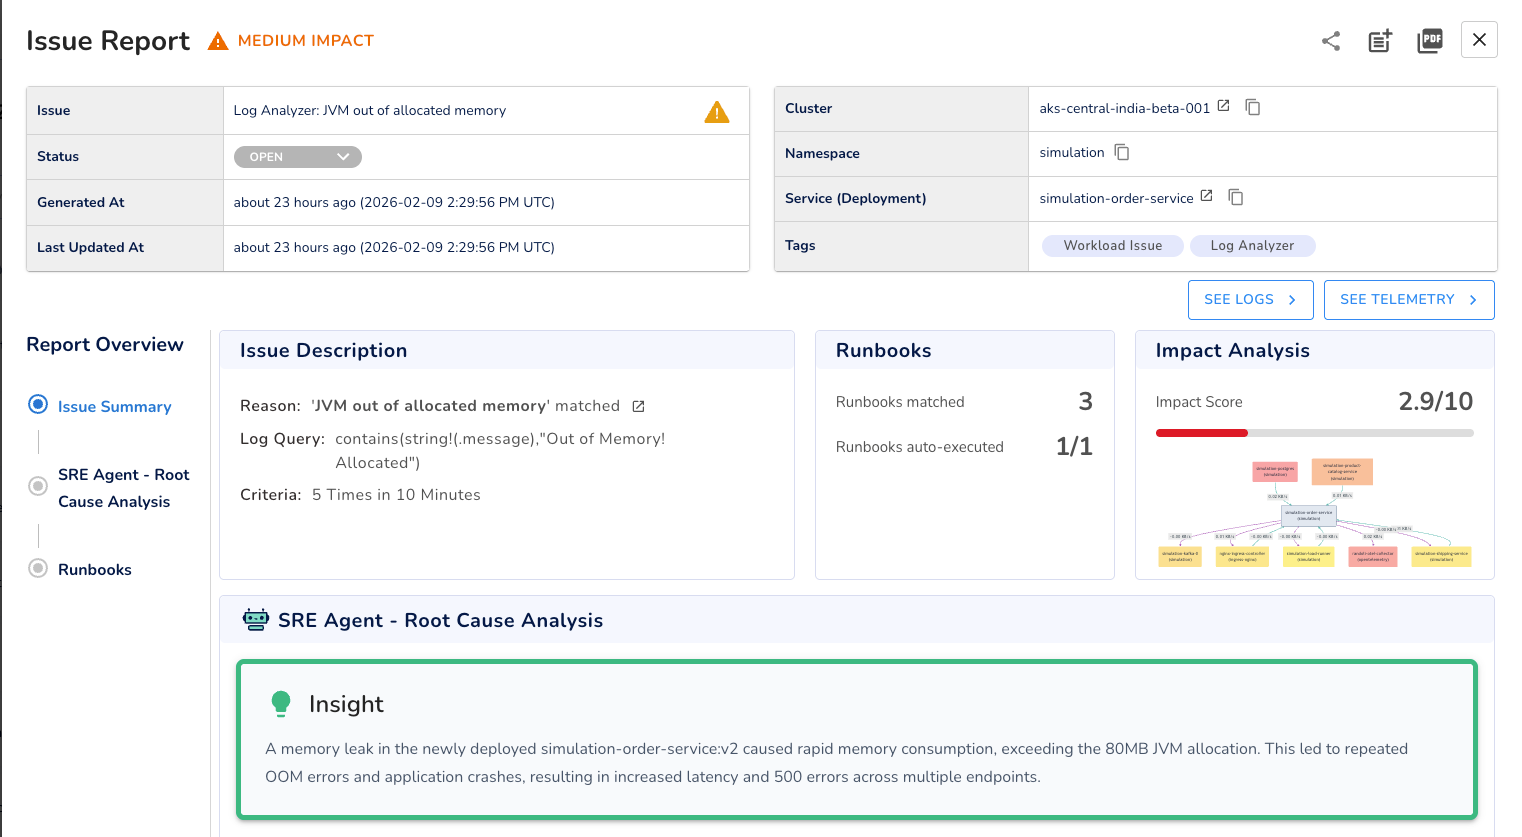
By visualizing these events as a sequence rather than reviewing them in isolation, teams can quickly recognize that the issue is not a one-off anomaly but an emerging incident that requires investigation and intervention.
By focusing on these core pillars , teams gain faster incident resolution, clearer root-cause insight, and scalable observability that reduces noise and operational overhead.
Good log monitoring is not about capturing everything, it's about capturing the right data in a way that supports operational decision-making. By prioritizing meaningful signals, adding context, and structuring logs for efficient querying, teams turn logs into actionable insights instead of overwhelming noise.
When logs are correlated with metrics and traces, visualized for patterns, and governed for consistency, they become a trusted operational asset.
This approach reduces time to detection and resolution, improves cross-team collaboration, and ensures observability scales with modern distributed systems. To learn more about log management and analysis, refer to the Randoli official documentation.

.png)


