How to Monitor and Control GenAI Costs in Production
February 24, 2026
Tags:
Cost Management
Best Practices
Generative AI
Imagine this: You get your observability bill at the end of the month. Traffic hasn’t changed. Latency looks stable. The error rate is normal. Yet GenAI spend is up, and no one can explain why.
That’s the shift GenAI introduces in production: cost doesn’t just scale with traffic, it scales with behavior i.e. prompt length, model choice, routing logic, retries.
In this post, we’ll look at what production-grade GenAI cost visibility actually looks like in practice. We’ll walk through the most common operational gaps teams run into and show how those gaps can be closed by treating cost as a first-class runtime signal, making it traceable, attributable, and actionable before the next spike shows up on a bill.
In most teams, cost lives in billing dashboards. It’s reviewed at the end of the week, or worse, at the end of the month. But by the time a spike shows up there, the context is already gone. The deploy has happened, the prompt has changed, the fallback model has kicked in, and no one remembers exactly what shifted.
Production systems don’t get debugged in billing portals. They get debugged through telemetry that can be correlated to services, routes, and releases. So, if GenAI cost is going to be predictable, it has to behave the same way. Token usage, model selection, and request patterns need to show up as runtime signals, not after-the-fact summaries.
Once cost becomes something engineers can inspect, query, and correlate in real time, it stops being a finance surprise and starts becoming an operational variable. That shift is what makes true cost control possible in production.
One of the most common cost surprises in production has nothing to do with traffic.
A prompt gets longer. A system message changes. A feature adds retrieval context. Token usage per request increases gradually, but overall request volume stays the same. From the outside, nothing looks different, until the bill arrives.
The problem is that token consumption is usually hidden behind API calls. Traditional metrics show request count, latency, error rate. Billing dashboards show aggregate spend. But neither explains why the cost per request changed. Without token-level visibility at the application layer, engineers are left guessing which workflow, prompt path, or background job caused the shift.
In production, token usage needs to behave like any other runtime signal. It should be captured per request, correlated to the service or route that triggered it, and visible alongside other operational metrics.
In Randoli, token consumption and model cost are surfaced directly within the observability workflow, so when a cost spike happens, teams can trace it back to the exact workload or change that introduced it.
Once token usage becomes inspectable in real time, cost stops being a monthly artifact and becomes something teams can reason about while the system is running.
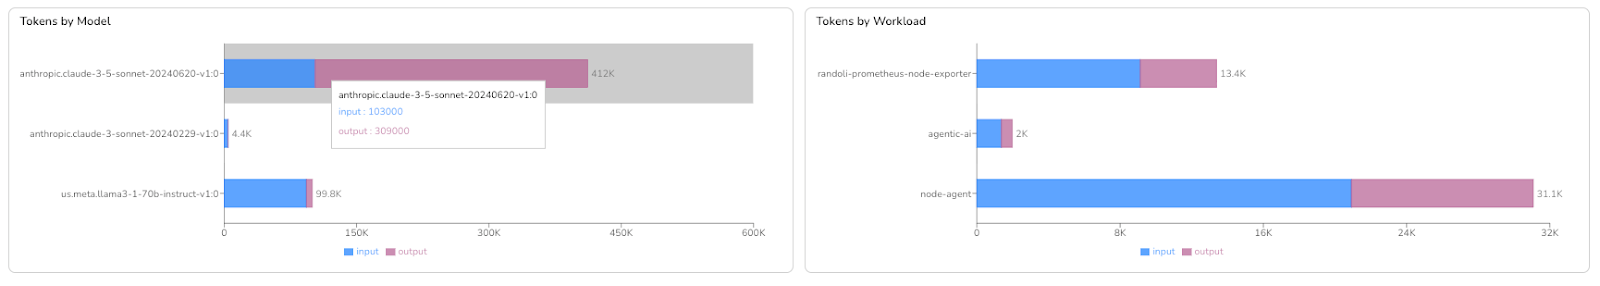
In production, GenAI usage rarely flows through a single model for long. Teams add fallbacks, experiment with new versions, or route different workflows to different models. Over time, your application ends up relying on a mix of models to power different features and workflows.
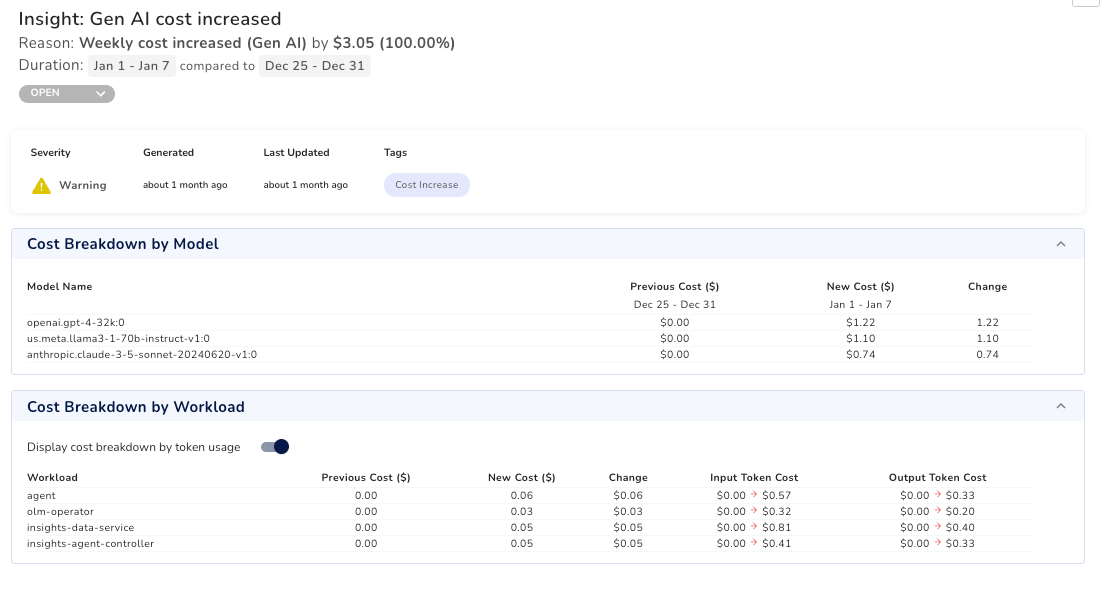
The blind spot isn’t that teams don’t know which models they use. It’s that they can’t clearly see how usage and cost break down across them. Billing is often aggregated at the provider level, so when spend increases, it’s hard to answer a basic question: which model is actually responsible?
Small shifts make this harder. Under load, a fallback path might trigger more often than expected, and nothing looks broken. Latency is fine. The error rate is flat. But if that fallback model costs 3x more per 1,000 tokens, a small routing drift can quietly reshape your spend.
In Randoli, spend is broken down by provider, model, and version, so teams can see that mix directly and track how it evolves over time. If usage starts drifting toward a more expensive model, it’s visible early. That makes the conversation concrete: tune routing, adjust thresholds, or accept the tradeoff intentionally.
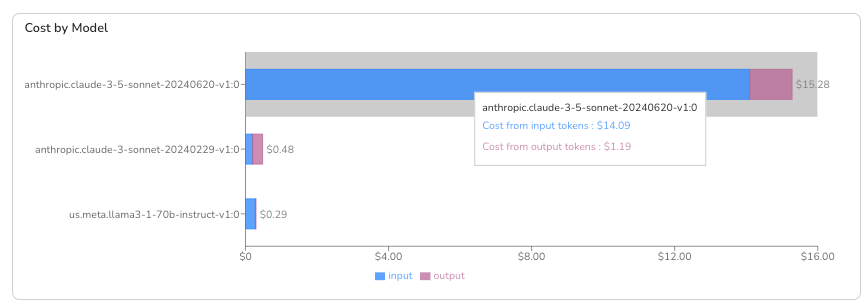
Predictable cost doesn’t require locking into one model. It requires being able to see when your model mix changes, and deciding whether that change was on purpose.
Even when teams can see which models are driving cost, the next question is harder: where is that usage actually coming from?
Most GenAI billing is aggregated at the provider account or API key level. That tells you how much you spent, but not which service, environment, or workflow was responsible. When Finance sees a spike, the conversation usually starts with, “Which team owns this?” and no one has a clear answer.
In production, that gap slows everything down. Engineers might know that a model is being used, but tying that usage back to a specific backend API, agent workflow, or feature often requires jumping between logs, traces, and billing dashboards. Cost becomes a shared blind spot instead of an owned signal.
To make cost actionable, it has to be attributed the same way other production signals are: by service, environment, route, or workload. In Randoli, token usage and cost are tied directly to the workloads generating them, so teams can see which services or agents are driving spend in real time. Instead of debating at the account level, you can ask a concrete question: which workload changed, and why?
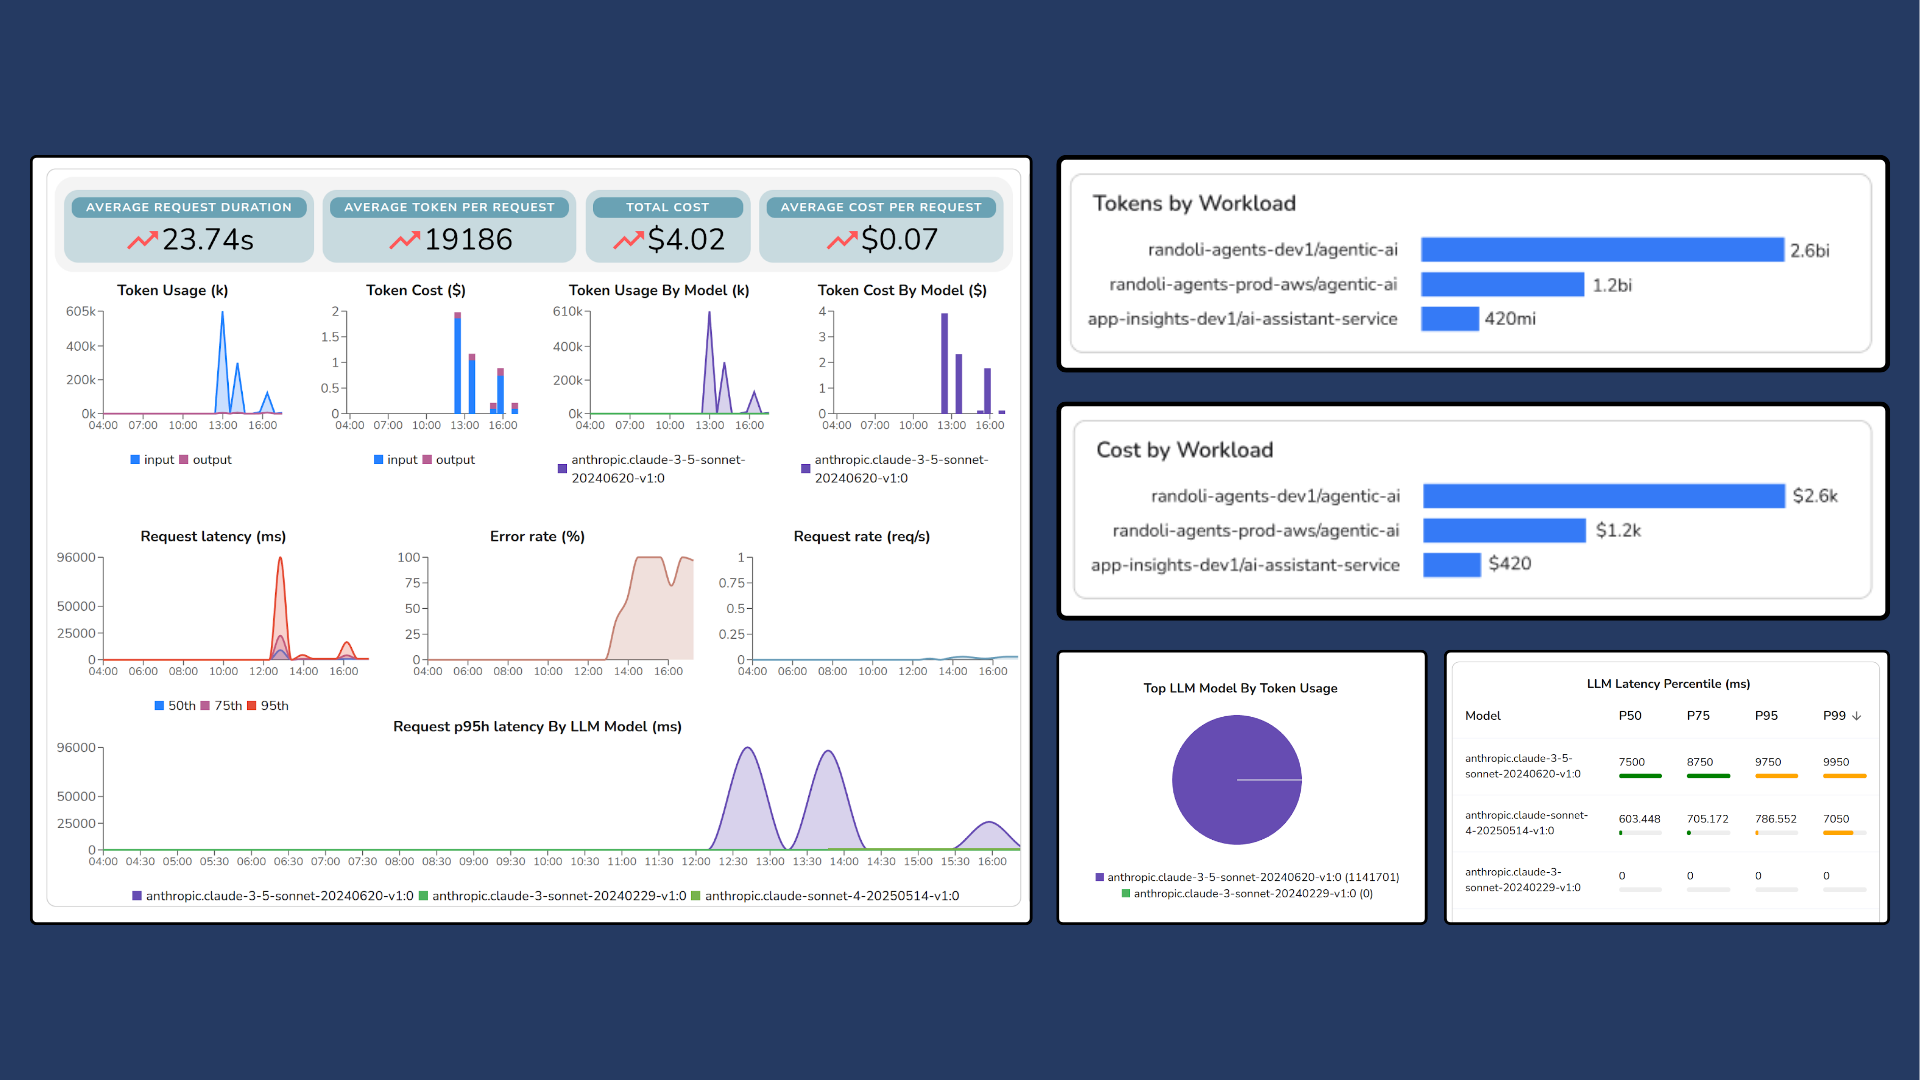
When cost is attributed at the workload level, optimization becomes concrete. It turns into a focused engineering decision tied to specific parts of the system.
When cost is attributed at the workload level, optimization becomes concrete. It turns into a focused engineering decision tied to specific parts of the system.
One of the biggest reasons GenAI costs feel unpredictable isn’t just visibility, it’s timing.
By the time a spike shows up in a billing dashboard, the usage pattern that caused it may be days or weeks old. A prompt change increased output tokens. A routing tweak sent more traffic to a larger model. Retries quietly doubled usage under load. Each retry replays the full prompt, so token usage climbs fast and you only notice once the bill aggregates it.
Without real-time alerts, you end up in a reactive loop: cost increases first, and only later does the investigation begin.
To prevent that, cost needs to generate alerts the same way latency or error rate does. Instead of relying on delayed billing data, you need thresholds tied to real usage signals such as token consumption, model mix shifts, or sudden growth relative to traffic.
With Randoli, you can define token-based thresholds by service, cluster, or model and trigger alerts when usage crosses those limits. That means cost anomalies surface while the system is running, not after the invoice arrives.
Shortening the feedback loop is what turns cost control from post-mortem analysis into proactive operations.
When GenAI cost becomes part of your observability stack, the conversation changes.
A spike isn’t something you discover in a billing report weeks later. It’s something you correlate to a deploy, a prompt change, a routing rule, or a specific workload while the system is running. Token usage shows up alongside latency and error rate. Model mix shifts are visible as they happen. Spend is attributed to the services and workflows that generated it.
Taken together, these capabilities form a complete cost control loop: capture token usage at runtime, break down spend by model, attribute it to workloads, and alert early when usage drifts. Cost stops being a separate finance artifact and starts behaving like any other production signal.
Randoli brings these signals into the same workflow you already use to debug performance and reliability, so cost becomes part of how you operate the system, not a separate concern.
The goal isn’t to eliminate cost. It’s to understand it while the system is running. GenAI cost won’t become predictable by accident, it becomes predictable when it’s observable.
Want to make GenAI cost observable in your own production stack? Start a 30-day free trial of Randoli here.
.png)
.png)


