How to Monitor Go Applications with OpenTelemetry
January 20, 2026
Tags:
Observability
OpenTelemetry
Golang services often power high-throughput, low-latency backends built around concurrency and shared dependencies. In production, teams encounter tail-latency spikes, goroutine leaks under load, and slow downstream calls that are hard to trace across handlers and concurrent execution paths without proper instrumentation.
OpenTelemetry provides a standardized way to make Golang applications observable through traces, metrics, and contextual signals, while staying vendor neutral.
In this guide, we will walk through how to monitor a Golang application using OpenTelemetry , focusing on industry-standard signals, real production pain points being faced across frameworks and deployment environments.
Before even instrumenting a Golang service, it’s important to be clear about which signals provide meaningful visibility in production. Effective monitoring relates to capturing the data that helps to quickly understand performance regressions, dependency issues, and failure patterns.
When Go runtime instrumentation is enabled, OpenTelemetry automatically emits runtime-level metrics that reflect how the Go scheduler, memory manager, and garbage collector behave under real workload conditions. Few important metrics to observe are :
Goroutine count (go.goroutine.count) - Reports the number of live goroutines, useful for detecting goroutine leaks and unbounded concurrency.
Heap memory allocated (go.memory.allocated) - Tracks the amount of memory allocated to the heap by the application, often correlating with GC frequency and latency.
Heap allocation count (go.memory.allocations) - Measures the number of heap allocations, helping surface excessive object creation and allocation-heavy code paths.
GC heap goal (go.memory.gc.goal) - Shows the target heap size for the end of a garbage collection cycle, providing insight into GC tuning and behavior.
GC activity and pauses (runtime.go.gc.count, runtime.go.gc.pause_ns, runtime.go.gc.pause_total_ns) - Provide visibility into GC frequency and stop-the-world pause impact on application latency.
These metrics help teams identify slowdowns, saturation, and instability before users report issues.
Traces provide request-level visibility, showing how individual requests move through the application and its dependencies.
For Golang services, traces are especially valuable in highly concurrent workloads, where fan-out patterns and asynchronous execution make performance issues difficult to diagnose using metrics or logs alone.
In Golang applications, failures often occur inside concurrent goroutines or retries where request context is lost, making issues hard to diagnose using metrics or traces alone. Structured logs, correlated with trace and span IDs, capture precise error and state information and link it back to the originating request for faster debugging.
By monitoring these three signals, you gain comprehensive visibility into your Go application's performance and health in a distributed environment.
With a clear understanding of what to monitor and why, the next step is to instrument the Golang application so these signals are emitted consistently
To make a Golang service observable, its runtime must emit traces, metrics, and logs that reflect real execution behavior. OpenTelemetry provides a standardized framework to generate this telemetry consistently across services and environments.
At a high level, OpenTelemetry enables observability in two ways:
In this guide, we will use Go SDK–based auto-instrumentation, where telemetry is automatically generated by instrumented libraries (HTTP servers, clients, runtimes) after initializing the OpenTelemetry SDK.
To begin instrumentation, we first add the required OpenTelemetry packages to your Go module ( go.mod file)
go get go.opentelemetry.io/otel
go get go.opentelemetry.io/otel/sdk
go get go.opentelemetry.io/otel/exporters/otlp/otlptrace/otlptracegrpc
go get go.opentelemetry.io/otel/exporters/otlp/otlpmetric/otlpmetricgrpc
go get go.opentelemetry.io/otel/sdk/metric
go get go.opentelemetry.io/otel/sdk/resource
go get go.opentelemetry.io/otel/propagation
go get go.opentelemetry.io/contrib/instrumentation/net/http/otelhttp
go get go.opentelemetry.io/contrib/instrumentation/runtime
go.opentelemetry.io/otel - Core OpenTelemetry API (tracers, meters)go.opentelemetry.io/otel/sdk - SDK implementation that creates and manages telemetrygo.opentelemetry.io/otel/sdk/metric - Metric pipeline for collecting and exporting application metricsotlptracegrpc / otlpmetricgrpc - Export traces and metrics using the OTLP protocolotelhttp - Automatic instrumentation for HTTP servers and clientsgo.opentelemetry.io/contrib/instrumentation/runtime - Automatically collects and reports Golang runtime metrics such as goroutine count, memory allocation, and garbage collection behavior.
By adding these dependencies, the application becomes capable of emitting standardized traces and metrics, automatically instrumenting HTTP traffic, and exporting telemetry to any OpenTelemetry-compatible backend.
OpenTelemetry should be initialized once when the application starts. A common practice is to isolate all observability-related setup into a single file to keep the rest of the application clean.
By creating a new file named otel.go , or directly add the below code inside your main.go file.
package main
import (
	"context"
	"log"
	"time"
	"go.opentelemetry.io/otel"
	"go.opentelemetry.io/otel/exporters/otlp/otlpmetric/otlpmetricgrpc"
	"go.opentelemetry.io/otel/exporters/otlp/otlptrace/otlptracegrpc"
	"go.opentelemetry.io/otel/propagation"
	sdkresource "go.opentelemetry.io/otel/sdk/resource"
	sdktrace "go.opentelemetry.io/otel/sdk/trace"
	"go.opentelemetry.io/otel/sdk/metric"
	semconv "go.opentelemetry.io/otel/semconv/v1.21.0"
	"go.opentelemetry.io/contrib/instrumentation/runtime"
)

func initOpenTelemetry(ctx context.Context) (func(context.Context) error, error) {

	// Resource (Service Identity)
	res, err := sdkresource.New(
		ctx,
		sdkresource.WithAttributes(
			semconv.ServiceNameKey.String("my-go-service"),
		),
	)
	if err != nil {
		return nil, err
	}
	// Traces
	traceExporter, err := otlptracegrpc.New(ctx)
	if err != nil {
		return nil, err
	}
	tracerProvider := sdktrace.NewTracerProvider(
		sdktrace.WithBatcher(traceExporter),
		sdktrace.WithResource(res),
	)
	otel.SetTracerProvider(tracerProvider)
	// Metrics
	metricExporter, err := otlpmetricgrpc.New(ctx)
	if err != nil {
		return nil, err
	}
	meterProvider := metric.NewMeterProvider(
		metric.WithReader(
			metric.NewPeriodicReader(
				metricExporter,
				metric.WithInterval(10*time.Second),
			),
		),
		metric.WithResource(res),
	)
	otel.SetMeterProvider(meterProvider)

	//  Go Runtime Metrics
	if err := runtime.Start(
		runtime.WithMinimumReadMemStatsInterval(10*time.Second),
	); err != nil {
		return nil, err
	}
	//  Context Propagation
	otel.SetTextMapPropagator(
		propagation.NewCompositeTextMapPropagator(
			propagation.TraceContext{},
			propagation.Baggage{},
		),
	)
	// Shutdown
	shutdown := func(ctx context.Context) error {
		if err := tracerProvider.Shutdown(ctx); err != nil {
			log.Printf("trace shutdown error: %v", err)
		}
		if err := meterProvider.Shutdown(ctx); err != nil {
			log.Printf("metric shutdown error: %v", err)
		}
		return nil
	}
	return shutdown, nil
}
Resource (Service Identity) - Defines who this service is so traces and metrics can be grouped and queried correctly.Traces- Configures distributed tracing and exports spans to an OpenTelemetry backend.Metrics - Initializes metrics collection and periodically exports measurements like counters and histograms.Context Propagation - Ensures trace context flows across HTTP requests, goroutines, and downstream servicesShutdown Function - Flushes pending telemetry data when the application exits.Go Runtime Metrics - Starts automatic collection of Golang runtime metrics (memory, GC, goroutines) using the configured OpenTelemetry meter provider.
This step allows traces, metrics, and context propagation to be configured before your application starts handling traffic.
This initializes OpenTelemetry during application startup so all telemetry is captured from the very first request . Make the following changes in your main.go file with the code below:
func main() {
	ctx := context.Background()
	shutdown, err := initOpenTelemetry(ctx)
	if err != nil {
		log.Fatalf("failed to initialize OpenTelemetry: %v", err)
	}
	defer shutdown(ctx)
	// Start your HTTP server / app
	startServer()
}
This ensures telemetry providers are active before traffic starts and are cleanly shut down on application exit.
To automatically generate traces and metrics for incoming HTTP requests without writing manual spans , OpenTelemetry Go uses library-level auto-instrumentation, meaning HTTP frameworks built on net/http can be instrumented by wrapping the request handler.
In this example below we're using , net/http-based Server
handler := http.NewServeMux()
handler.HandleFunc("/health", healthHandler)
wrappedHandler := otelhttp.NewHandler(handler, "http-server")
http.ListenAndServe(":8080", wrappedHandler)
This creates one trace per request with HTTP method, route, status code, latency, and context propagation.
Note: If You Are Using a Framework
Most Go HTTP frameworks (Gin, Chi, Echo) internally use net/http, so OpenTelemetry provides framework-specific middleware for convenience.
For example inGin:import"go.opentelemetry.io/contrib/instrumentation/github.com/gin-gonic/gin/otelgin"
r:= gin.New()
r.Use(otelgin.Middleware("my-go-service"))
r.GET("/albums", getAlbums)
r.Run(":8080")
This will automatically instrument all Gin routes, emitting request traces, route-level latency, and error attribution without manual span creation.
If your framework does not provide a dedicated OpenTelemetry middleware, wrapping the underlying net/http handler (shown above) is sufficient.
Note : OpenTelemetry Export Configuration ( Kubernetes)
In Kubernetes environments, exporter configuration should not be hardcoded in the application. OpenTelemetry supports environment-based configuration to control where traces and metrics are exported.OTEL_SERVICE_NAME=my-go-serviceThis enables the same application image to be deployed across environments while centrally controlling telemetry export.
OTEL_EXPORTER_OTLP_ENDPOINT=http://otel-collector:4317
OTEL_EXPORTER_OTLP_PROTOCOL=grpc
OTEL_TRACES_EXPORTER=otlp
OTEL_METRICS_EXPORTER=otlp
We achieved a fully instrumented Golang app at the request and runtime level. The service automatically emits traces and metrics for incoming requests, dependencies, and execution behavior, enabling end-to-end observability .
Once the Golang application is instrumented , the emitted telemetry can be visualized using any OpenTelemetry-compatible observability backend.
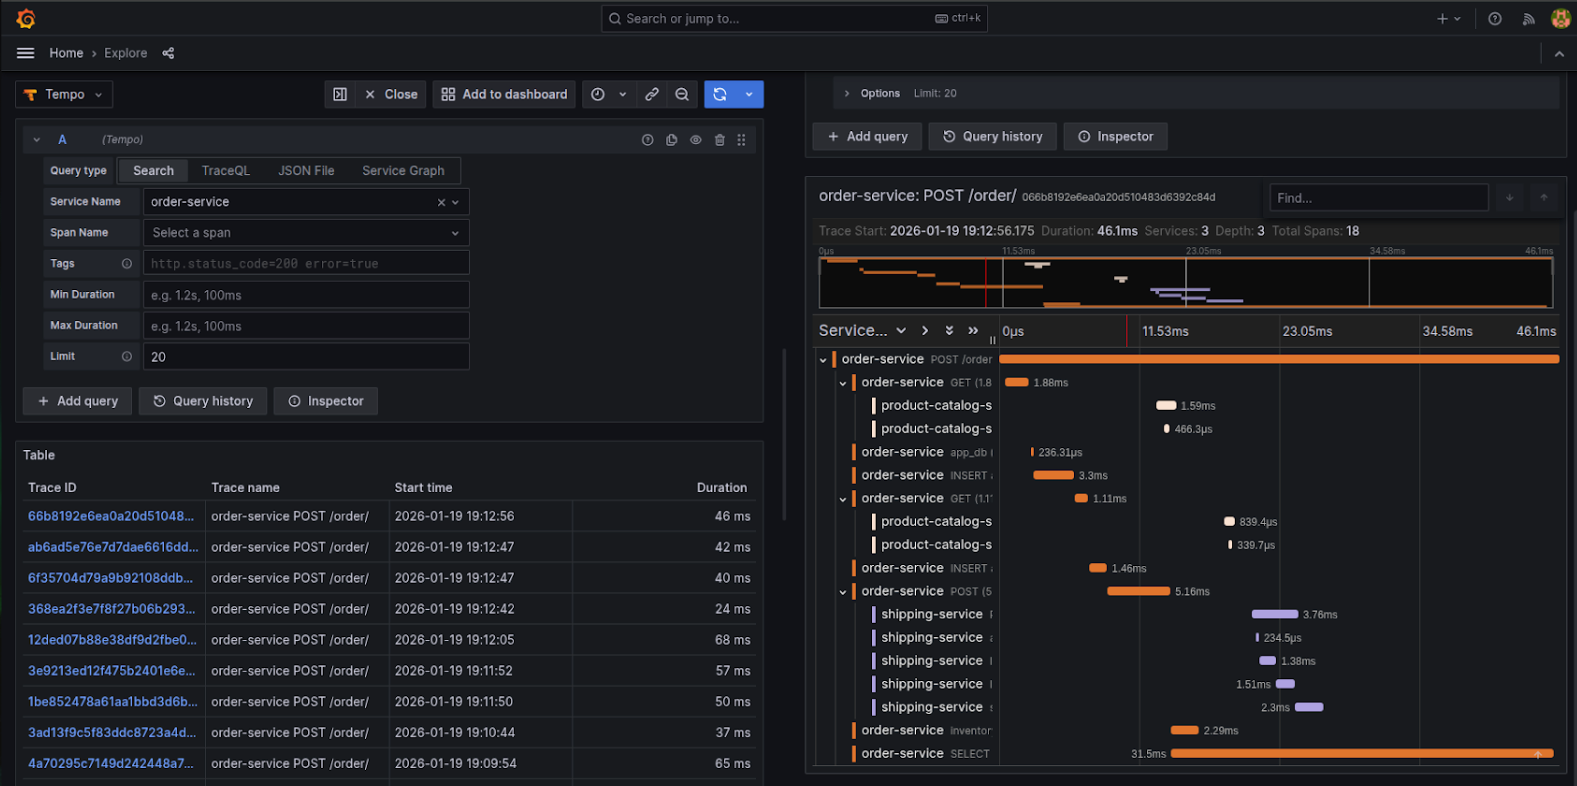
Here is an example of a visualization showing Go application distributed traces for order-service rendered in Grafana Tempo. It breaks down request execution across spans, services, and downstream dependencies, making it easier to analyze request latency, span timing, and cross-service interactions.
Next visualization that shows the same Go application in Randoli APM, correlating traces, runtime metrics, and service dependencies to provide a unified view of application behavior and performance.
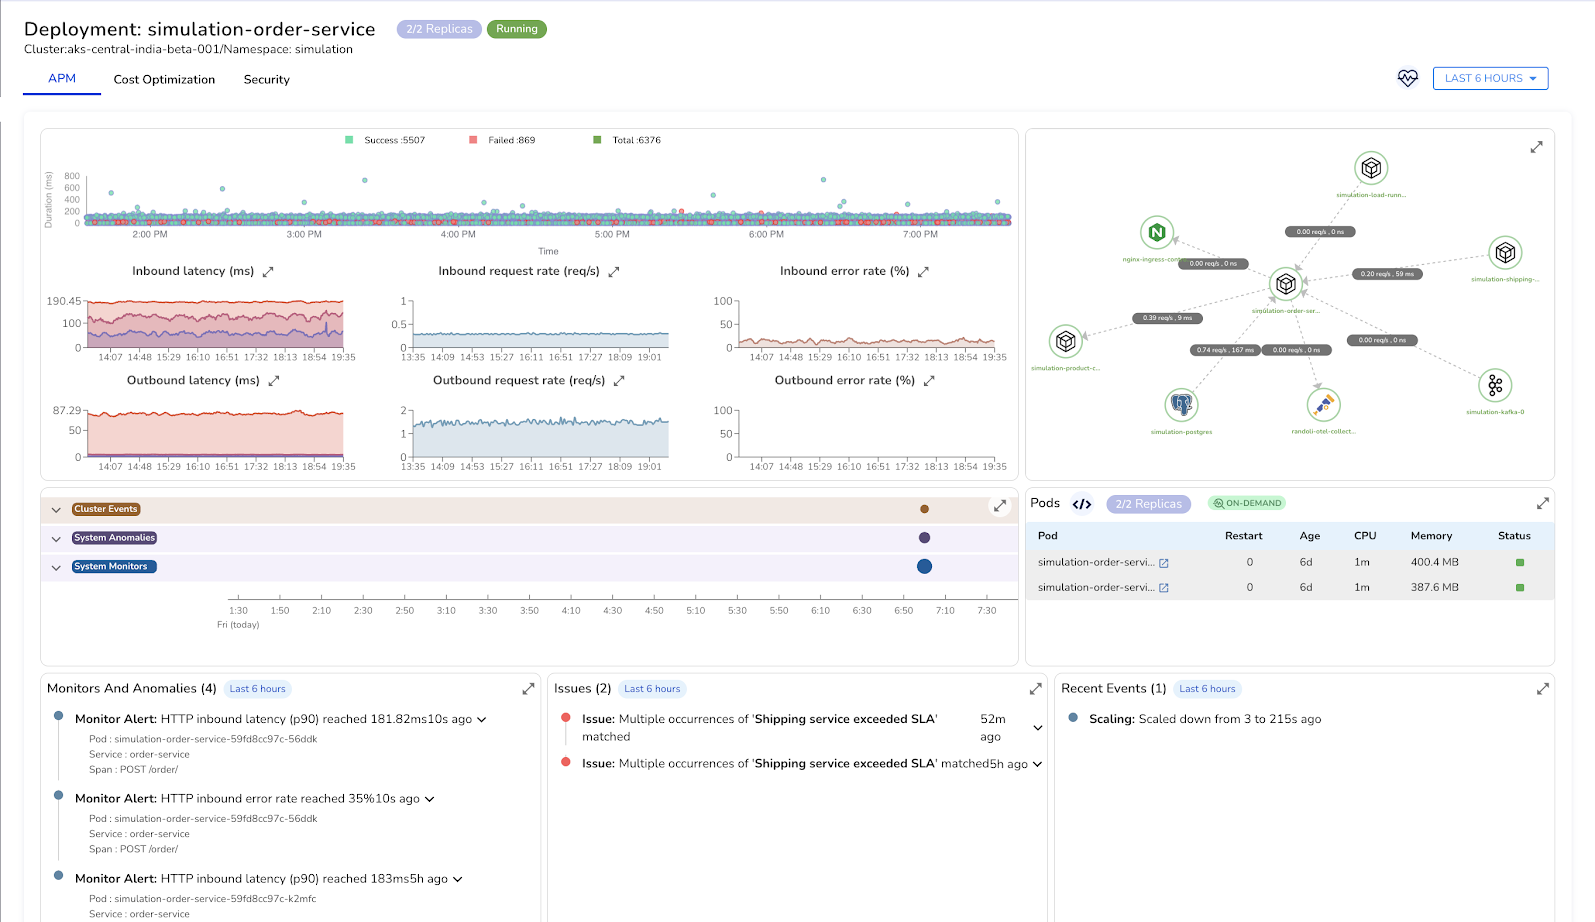
Together, these visualizations provide end-to-end visibility into request execution, service dependencies, and performance characteristics, enabling precise latency bottlenecks and operational issues.
In this guide, we made a Golang application observable by identifying the right signals to monitor and instrumenting the service using OpenTelemetry’s Go SDK based auto-instrumentation approach. Enabled HTTP-level instrumentation, and exporting telemetry via OTLP, the application now consistently emits traces and metrics that reveal request behavior, latency patterns, dependency impact, and runtime health without modifying core logic.
This approach provides a strong observability foundation that can be extended further as the application grows.To learn more check the official Instrumenting Go applications with the OpenTelemetry.

.png)


