How to Monitor Logs in Production
April 27, 2026
Tags:
Log Monitoring
Best Practices
.png)
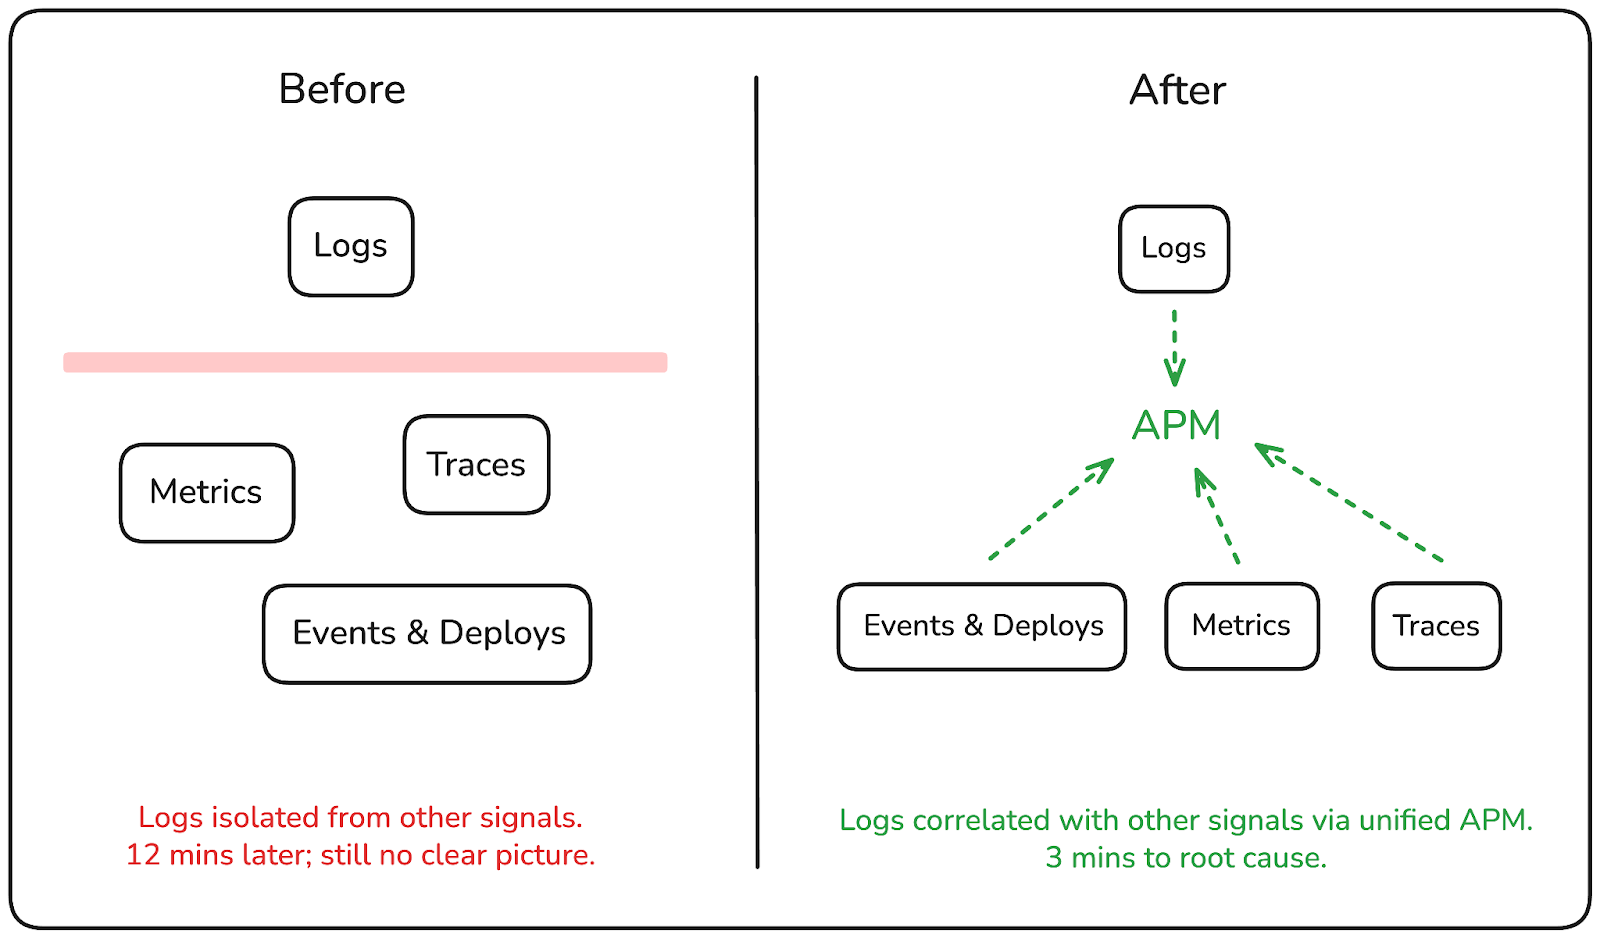
It's 2am. A monitor fires. You locate the error log, extract the trace ID from the message, context-switch to your tracing tool, track down the trace, then cycle back to logs to filter for the downstream service. Twelve minutes later, you have a partial picture, and the incident is still open.
That's the shift production log monitoring introduces at scale: the logs exist, the data is there, but the workflow for turning logs into answers is fragmented enough that the investigation itself becomes part of the problem.
In this post, we'll walk through the most common operational gaps teams run into with log monitoring in production and show how those gaps can be closed by treating logs as a first-class part of your investigation workflow, making them queryable, correlated, and actionable before the next incident escalates.
In most production systems, logs are treated as a record of what happened, something you search through after the fact. You know the approximate time window, you know the service, and you start querying. That works well enough when the problem is contained and the answer is sitting in a single log entry. In production at scale, it rarely is.
The teams that debug incidents faster aren't necessarily the ones with more logs. They're the ones where logs are connected to the rest of their telemetry, where a log entry leads directly to a trace, where volume spikes are visible before you start querying, and where recurring patterns surface automatically instead of waiting to be noticed.
That's the shift worth making: from logs as a passive archive to logs as an active part of how you investigate and respond.
When something breaks in production, you rarely know which service to look at first. It often starts with a symptom.
A latency spike, a failing health check, an error rate climbing, and you start digging. The problem is that in most environments, logs are scattered. Different services log to different places, namespaces have their own retention policies, and querying across all of it means switching between tools or running multiple searches and mentally stitching the results together. Under pressure, that process is slow and error-prone.
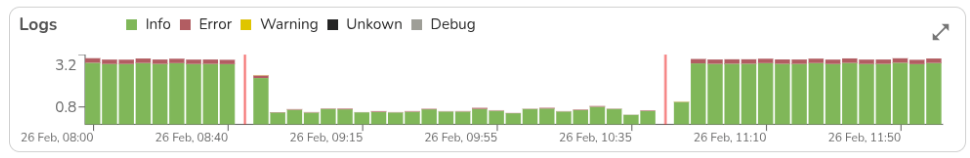
The other issue is volume. Production systems generate a lot of logs, and without a way to visualize where the activity is concentrated, you're starting every investigation blind. You might be querying the right service but the wrong time window, or chasing a red herring because the real spike happened two minutes earlier in a different service.
What you need instead is a single place to query logs across your entire environment. One that lets you filter by service, severity, namespace, and time range progressively, so you can narrow down from "something is wrong" to "this is exactly where it started" without switching contexts.
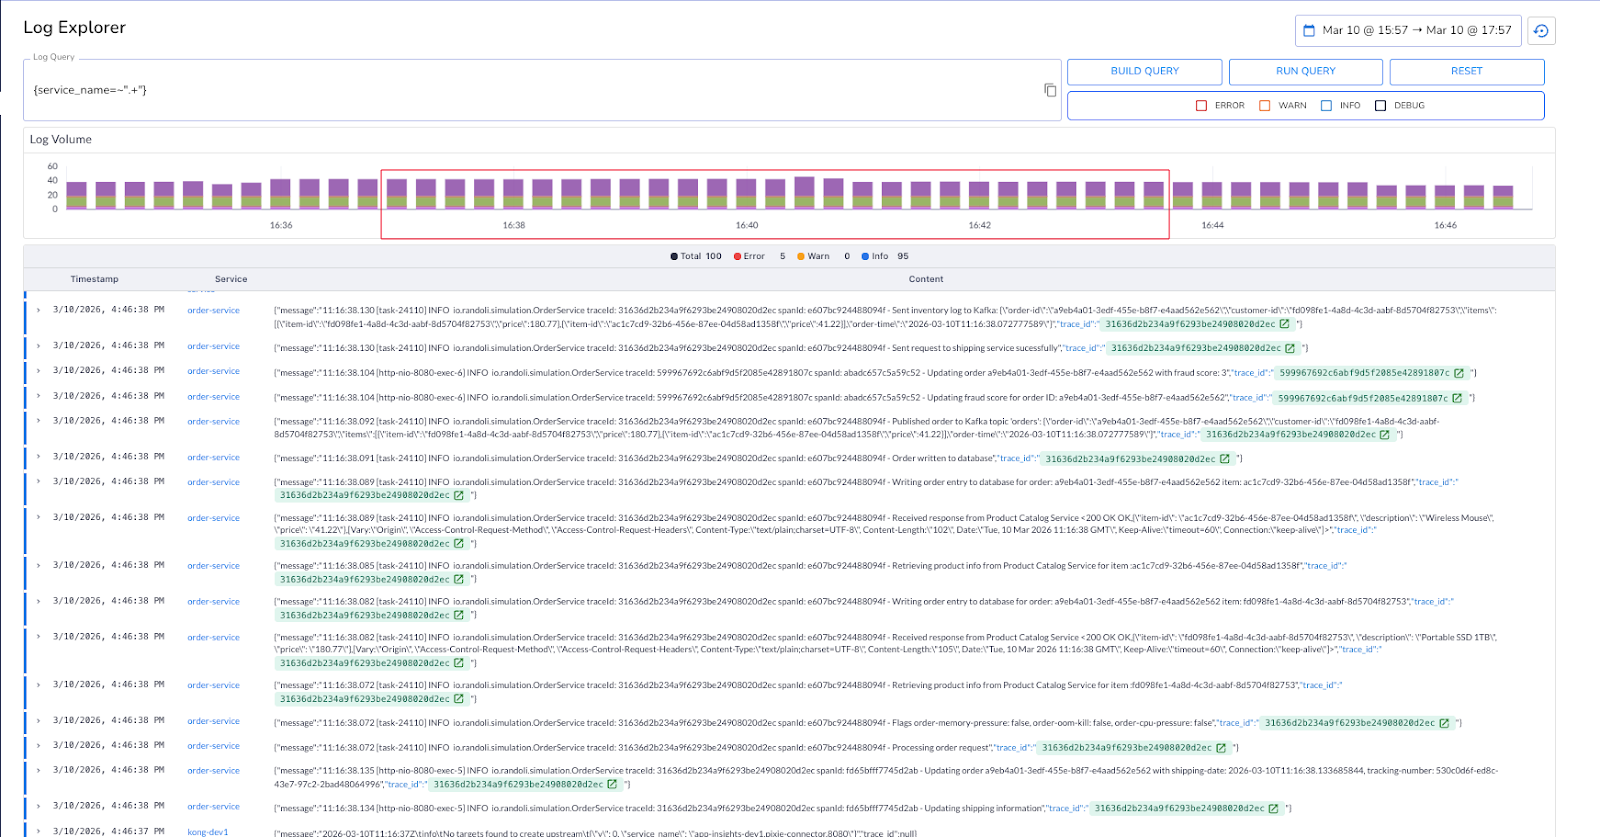
In Randoli, the Log Explorer gives you a centralized view across all your data planes, queryable using LogQL with a built-in query builder. The log volume graph lets you select a time window directly on the chart, so you're scoping your investigation to the exact window that matters, not scanning through noise.
When all your logs are queryable from one place, the first few minutes of an incident stop being spent just finding where to look.
Finding the error log is usually the easy part. What comes next is where the investigation slows down. You see an error in the order service, but the root cause may be three hops away in the shipping service.
The trace ID is right there in the log message, but it's just text. You copy it, switch to your tracing tool, search for it, and now you're looking at a distributed trace in an entirely different context from the logs you were just reading. If you need to cross-reference back, you switch again. In a microservices environment where a single request touches six services, that back-and-forth adds up fast, especially during a 2am incident.
The problem isn't the data. It's that the data is split across tools that don't talk to each other. Logs tell you something went wrong. Traces tell you where in the request it went wrong and why. You need both, in the same place, connected to each other.
In Randoli, logs are automatically correlated with traces using trace IDs, and you can open the associated trace directly in a side view without leaving the log context.
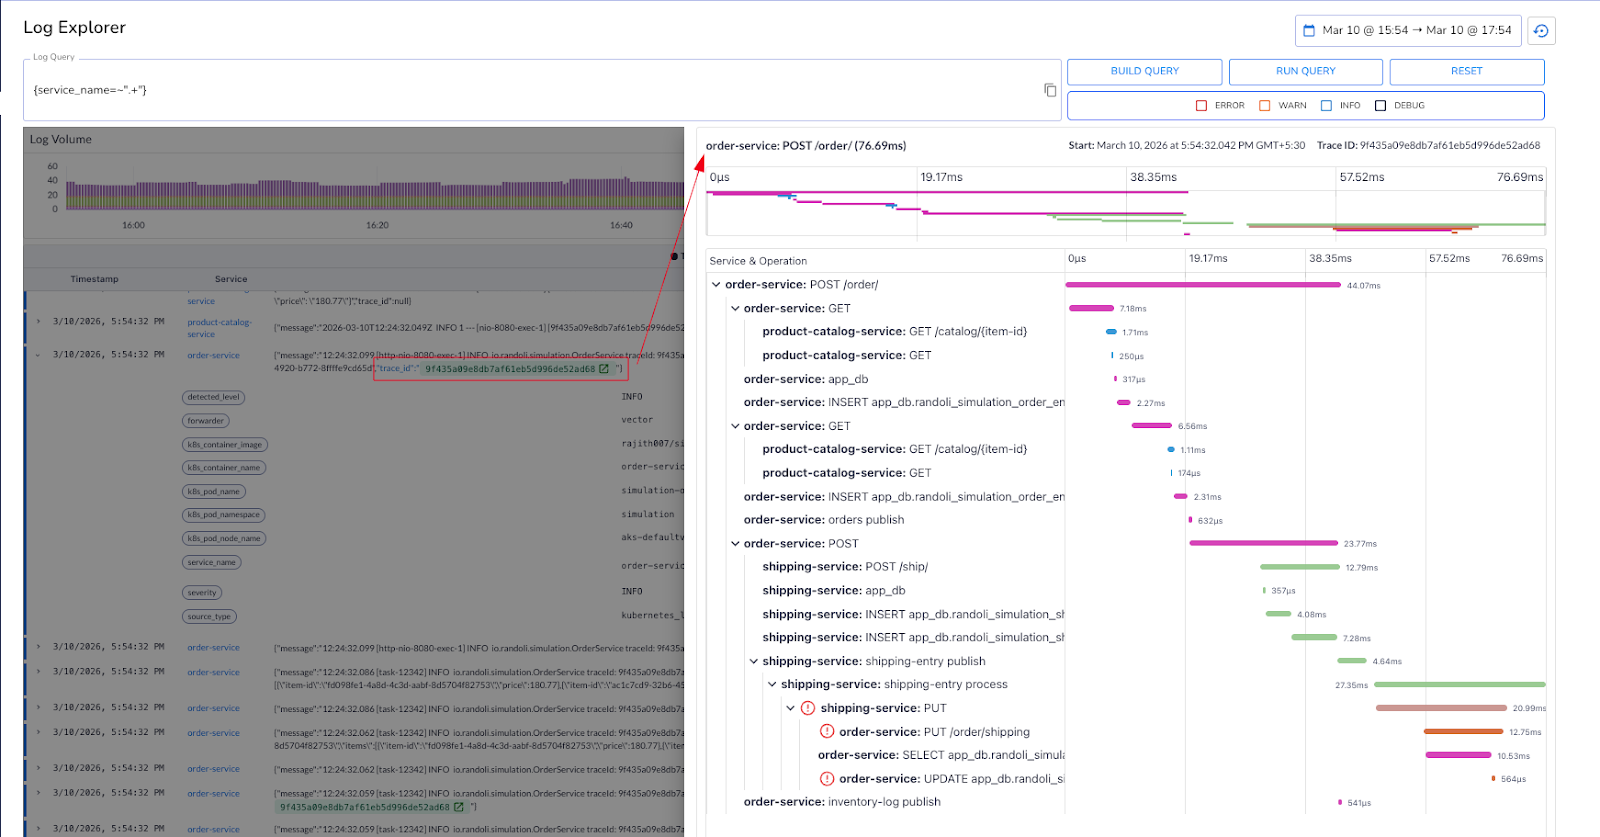
The difference between a twelve-minute investigation and a three-minute one is often just whether your logs link directly to what the request actually did.
Correlating a log entry to a trace tells you what happened in a single request. But production incidents rarely start and end there.
A memory spike in your metrics, a sudden increase in error traces, a surge in error-level logs, and a deployment event that happened ten minutes earlier, these are all part of the same story.
The problem is that most teams are reading each signal in isolation, which means the connection between them only becomes obvious in the post-mortem.
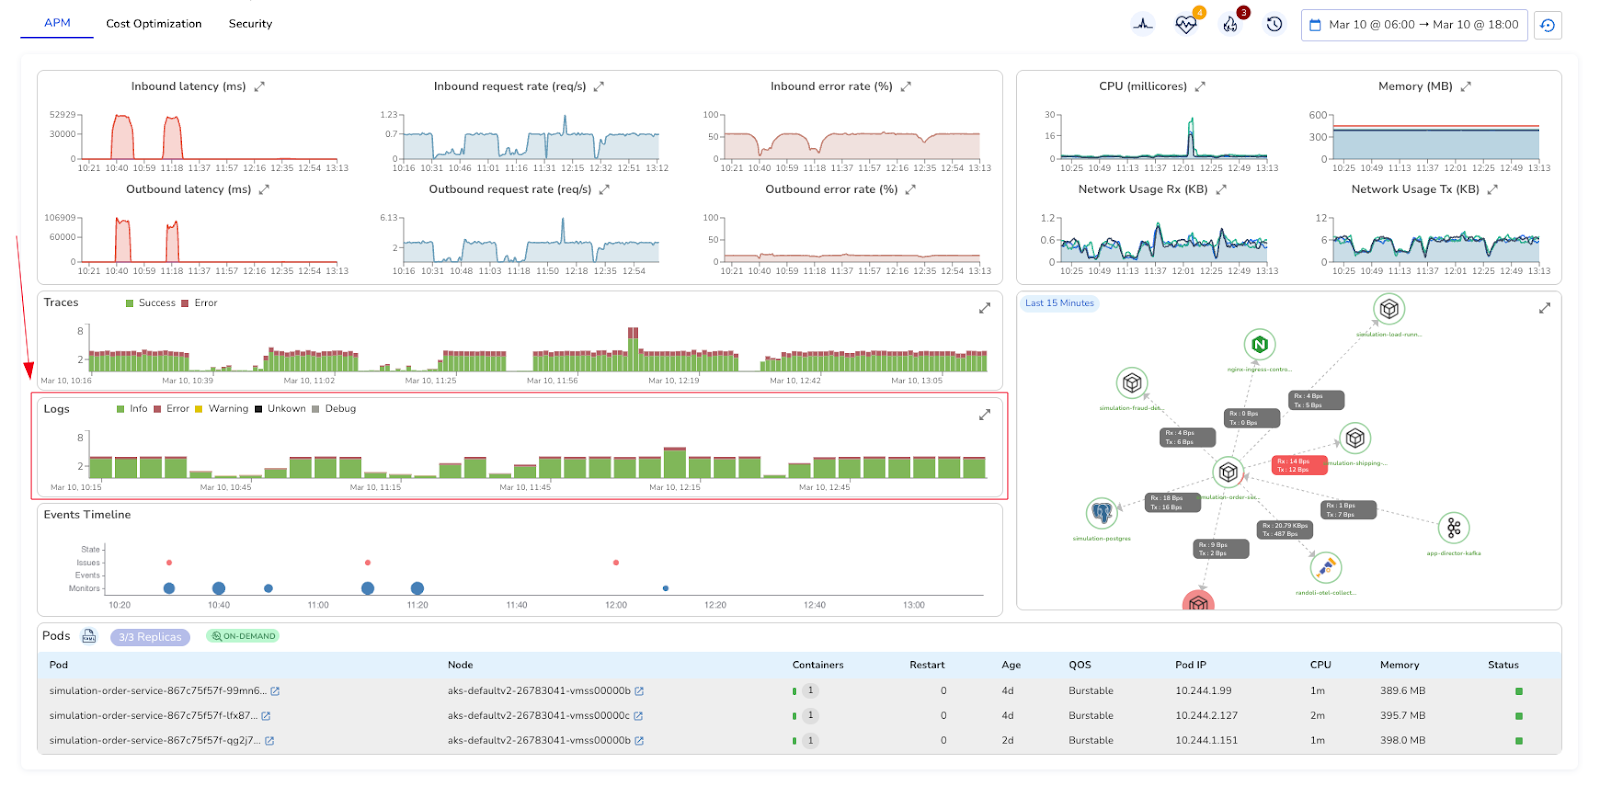
What changes the investigation is having all of those signals on the same timeline. When you can see log volume, trace success and error rates, infrastructure metrics, and the events timeline: state changes, deployments, monitor alerts, in a single view, patterns that were invisible across separate tools become immediately apparent.
In Randoli, the APM view surfaces logs alongside RED metrics (rate, error, duration), trace volume, resource usage metrics, and an events timeline for the same service and time window.
When error-level logs spike at the same moment latency climbs and a deployment event is visible on the timeline, you're not inferring the connection, you're seeing it directly.
The goal isn't to have more dashboards. It's to stop context-switching between them.
A single OOM error in your logs is easy to dismiss. You note it and move on. But if that same error appears five times in a ten-minute window, it's not an isolated event anymore. It could indicate a memory leak, a misconfigured resource limit, or a process under sustained resource pressure.
By the time you notice the pattern manually, the incident has usually already escalated.
A single database connection timeout is noise. The same timeout happening every 90 seconds, consistently, across the same service, is a signal worth acting on immediately. The difference between the two isn't the log entry itself, it's whether something is watching for the pattern.
Most teams handle this with custom alerting rules, which take time to write, are easy to get wrong, and still don't give you much context when they fire. You get a notification that a threshold was crossed, and then the investigation starts from scratch anyway.
In Randoli, Log Analyzers let you define the log pattern you want to continuously monitor, and trigger an action when it occurs within a specified time window. Once configured, it runs continuously. When the threshold is crossed, an Issue Report is automatically generated with AI-assisted root cause analysis from the SRE Agent, pre-approved runbook suggestions, and the contextual telemetry you need to act.
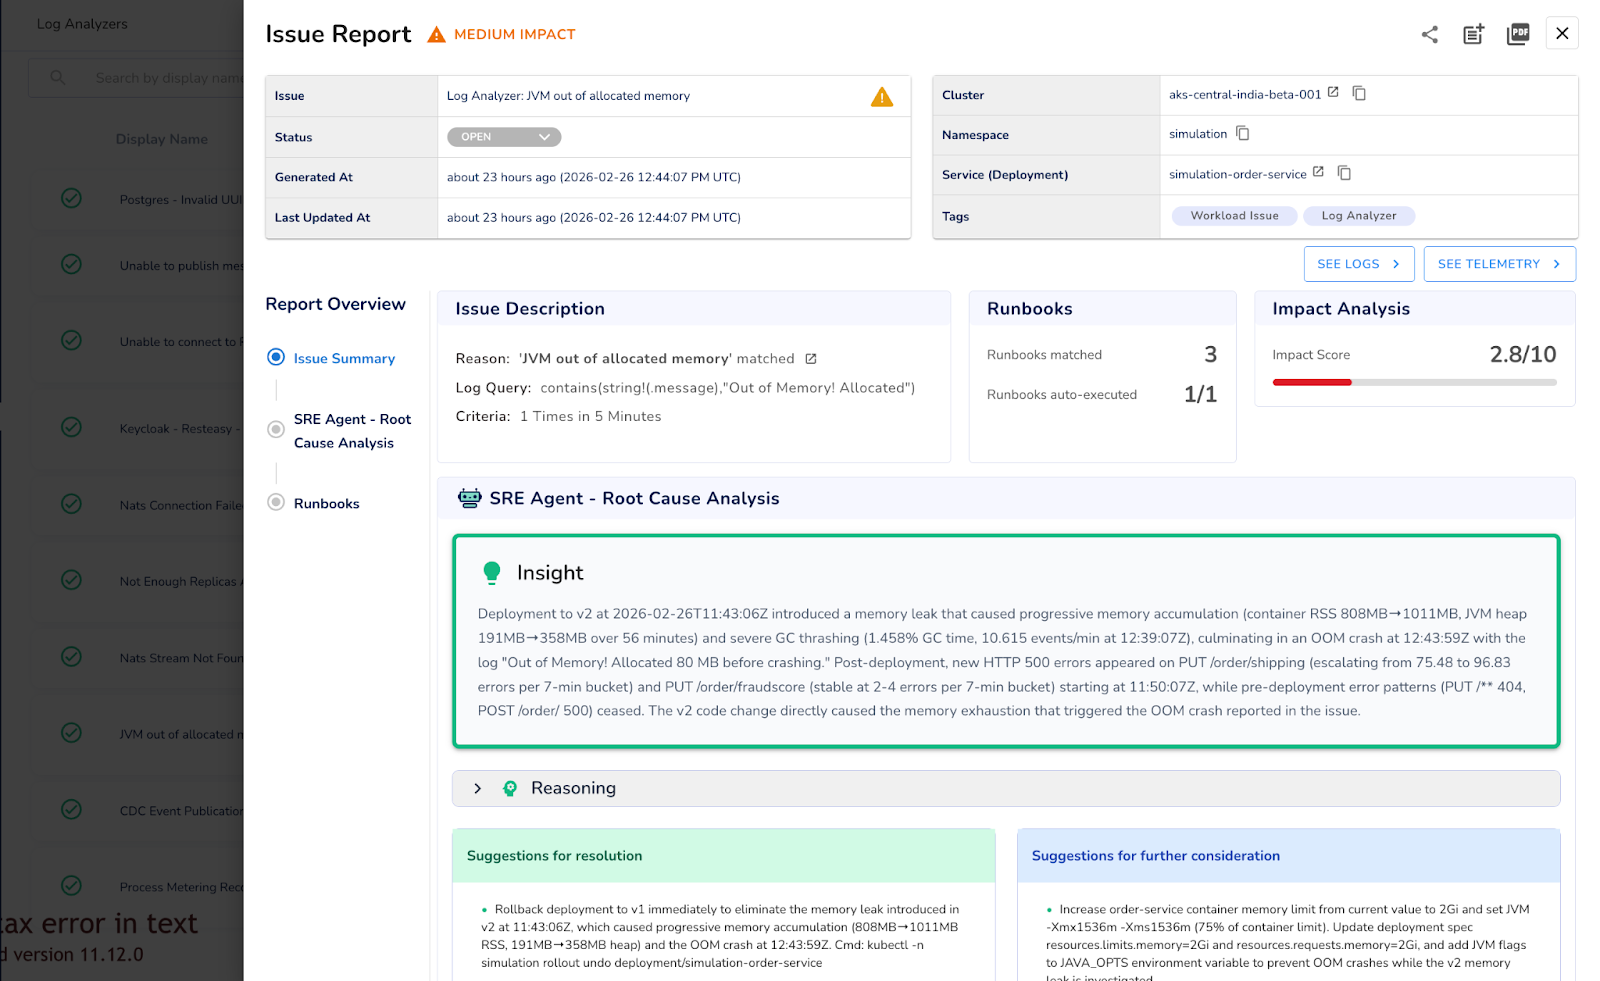
Because log analysis happens locally inside your environment, nothing leaves your environment and there's no per-GB ingestion or high egress cost to a third-party pipeline.
You can't manually spot a pattern while you're in the middle of responding to it. That's what Log Analyzers are for.
Log monitoring in production isn't just about having access to logs. It's about whether those logs can actually tell you what's wrong, fast enough to act. Unified querying, correlated signals across your APM view, log-to-trace correlation, and automated pattern detection all point to the same idea: logs need to be part of your investigation workflow, not a separate system you fall back to when everything else fails.
Randoli brings these signals into the same place you already use to debug performance and reliability, so logs stop being an afterthought and start being part of how you operate in production. The goal isn't to give you more logs to look at. It's to make the logs you already have actually useful when it matters most.
Log monitoring at scale doesn't get easier by having more tools, it gets easier when the right signal surfaces at the right moment.
Want to make log monitoring a first-class part of your production workflow? Start a 30-day free trial of Randoli here.
.png)
.png)


