Monitoring Kafka at Scale with OpenTelemetry
April 27, 2026
Tags:
Guide
Kafka Monitoring
Observability
OpenTelemetry
.png)
It's 2am. A deployment went out at 11am which looked clean, no errors. But a subtle change in the code introduced a faulty retry, adding a few extra milliseconds of processing time per message. By evening rush, consumers couldn't keep up. Messages piled up. And eventually, you have a full-blown production outage.
Here's the part that makes it worse: your brokers are still showing green.
That's the nature of Kafka incidents today. Kafka itself is a remarkably resilient piece of software: battle-tested, performant, designed to hold up under pressure. Most production teams will tell you that Kafka rarely fails outright. What fails is the visibility around it. You're watching the broker while the real problem has been quietly building in your consumer applications for hours.
This is the monitoring gap that causes 2am incidents: the right metrics weren't being tracked, the right signals weren't connected, and by the time something looked wrong on a dashboard, the system had already been degrading for hours.
In this post, we'll walk through what production-grade Kafka observability actually looks like: which metrics matter and why, where traditional monitoring falls short, and how an OpenTelemetry-native approach gives you the correlation and visibility you need to catch these problems before they become incidents.
The go-to approach for most teams is deploying a JMX agent alongside Kafka and scraping those metrics into Prometheus or any other metrics backend. It works. You get broker-level visibility, you build dashboards, and for a while it feels sufficient.
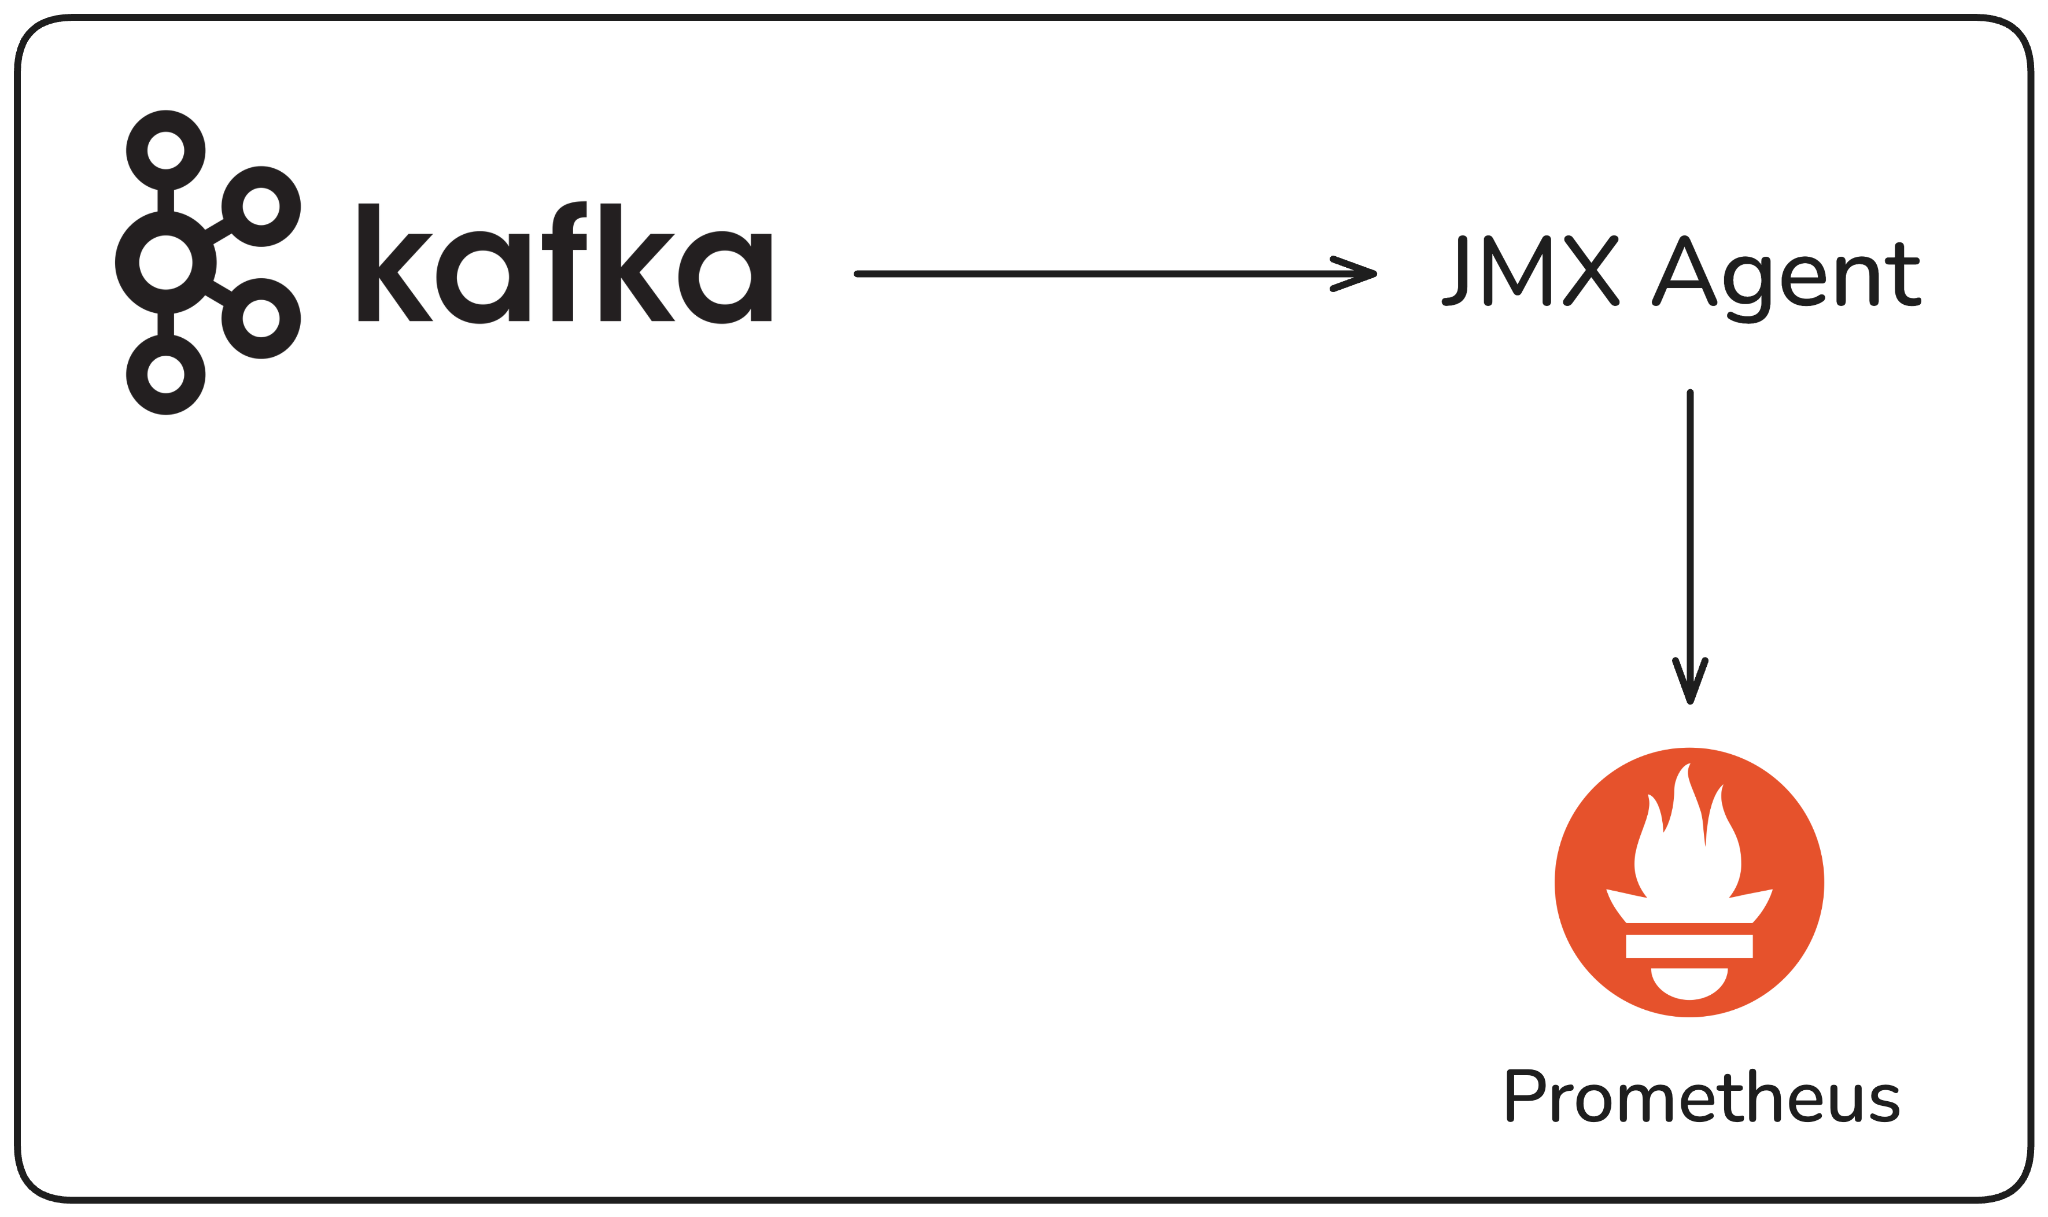
The problem is what it doesn't give you. JMX exposes broker internals, but it tells you nothing about what's happening on the application side. You can see that consumer lag is climbing, but you can't tell which consumer group is responsible, let alone which specific pod in that group is falling behind. To figure that out, you're manually running Kafka's consumer group CLI, extracting an IP, cross-referencing it in your Kubernetes cluster, and hoping the instance is still running by the time you get there. Under production pressure, that process breaks down fast.
The other gap is correlation. Your broker metrics, application metrics, and logs all live in separate tools. Connecting them during an incident requires manual effort, and that's exactly when you can least afford it.
This is what the traditional approach misses: not the broker metrics, but the connection between what the broker sees and what's actually happening in your applications.
Most teams already monitor CPU, memory, and JVM heap on their brokers. Those matter, but they're not where Kafka incidents usually start. The metrics that get missed are the ones that signal availability, durability, and performance degradation before things break completely.
Offline partitions is one of the most critical metrics to watch. Kafka distributes load across topics through partitions, and each partition can have a replication factor, meaning multiple copies exist across brokers.
If the broker holding a partition goes down and the replication factor for that topic is set to one, that partition goes offline. Producers can't publish to it, consumers can't read from it. If that partition belongs to a critical topic, the impact is immediate. Even one offline partition requires attention, therefore it should be treated as a critical signal, not background noise.
Active controller count tells you whether your cluster is being managed correctly. At any given time, there should be exactly one active controller in the cluster, this is the broker responsible for partition leader assignments and cluster state.
If you see zero, your cluster isn't functional. If you see more than one, you have a split-brain condition where the cluster state isn't being maintained properly. Both scenarios affect every producer and consumer application connected to that cluster.
Minimum broker count matters especially if you're running Kafka Raft (KRaft) mode i.e. Kafka's built-in consensus mechanism that replaces Zookeeper in newer versions (3.x+).
KRaft requires a quorum of at least three brokers to function. If your cluster drops below that, it can no longer maintain consensus and effectively stops working. Even if you haven't hit the minimum yet, monitoring for a degraded state, say, dropping from five brokers to four, gives you an early warning before you're actually in trouble.
Under-replicated partitions tell you that one or more partition replicas are falling behind the leader. In a production setup, you should have a minimum of three replicas per partition. If a replica can't keep up with the leader, that partition becomes under-replicated. This becomes dangerous when combined with your minimum in-sync replicas (ISR) configuration. ISR defines how many replicas must be in sync with the leader at all times.
If under-replicated partitions exceed your minimum ISR threshold and a broker goes down at that moment, the new leader being elected won't have the latest messages, and you will lose data. Setting a minimum ISR of at least two gives you a safety net.
Unclean leader elections are the confirmation that data loss has already happened. A clean leader election means a fully in-sync replica takes over when the leader goes down. An unclean one means no in-sync replica was available, so Kafka elected an out-of-sync replica instead. If this metric is greater than zero, messages were lost in that window. This is non-negotiable to alert on.
ISR shrink and expand events are worth watching as a leading indicator. Occasional fluctuation is normal, but if this metric is consistently noisy i.e. replicas repeatedly falling out of and back into sync, something is wrong.
The most common culprits are network saturation or JVM pressure on a specific broker. The key is to correlate the events to the broker they're happening on, so you can isolate whether it's a single broker under stress or a cluster-wide issue.
Request latency for fetch and produce operations is how Kafka communicates with producers and consumers at the protocol level i.e. every publish and every read is a typed request with a binary payload.
If fetch latency is climbing, the broker is struggling to read messages from disk fast enough. If produce latency is spiking, it may indicate write pressure or resource contention. Either way, a sustained increase here is a signal worth investigating immediately.
Disk and PV usage is one of the most commonly neglected broker metrics, and it's the one that tends to cause the most surprising outages. Unlike CPU or memory, disk fills up slowly and quietly, and Kafka, unlike traditional message brokers, retains messages on disk based on a retention policy regardless of whether they've been consumed. A team that isn't watching disk usage will eventually hit a wall at 2am. Monitor it per broker and per PV volume claim so you can catch it early.
Log flush time is the metric that sits at the intersection of performance and durability. Kafka batches messages and writes them to disk periodically rather than on every message and this is what gives it its throughput advantage.
But if log flush time starts increasing, your disk can't keep up with the write load. The tradeoff is real: flush less frequently and you get better performance but higher risk of message loss if a broker fails catastrophically. If you're seeing flush time grow, it usually points to a disk that needs upgrading and reducing incoming load is rarely a practical option in production.
If there's one metric that sits at the center of most Kafka production incidents, it's consumer lag. And seeing it and understanding what's causing it are two very different things.
Consumer lag is the gap between the last message produced to a topic and the last message your consumer has processed. When a consumer application can't keep up with the rate of incoming messages, lag builds and the downstream effects compound quietly. Order processing slows, data pipelines back up, SLOs start to degrade. The system doesn't fail loudly. It just gets progressively slower until it does.
Let’s see a classic scenario. A code change introduces a slightly slower processing path: an extra database call, a retry loop, a downstream API that started taking longer to respond.
In isolation, each message takes a few extra milliseconds. Under normal load, nobody notices. When traffic picks up, those milliseconds stack up across thousands of messages, and suddenly your consumer group is hours behind.
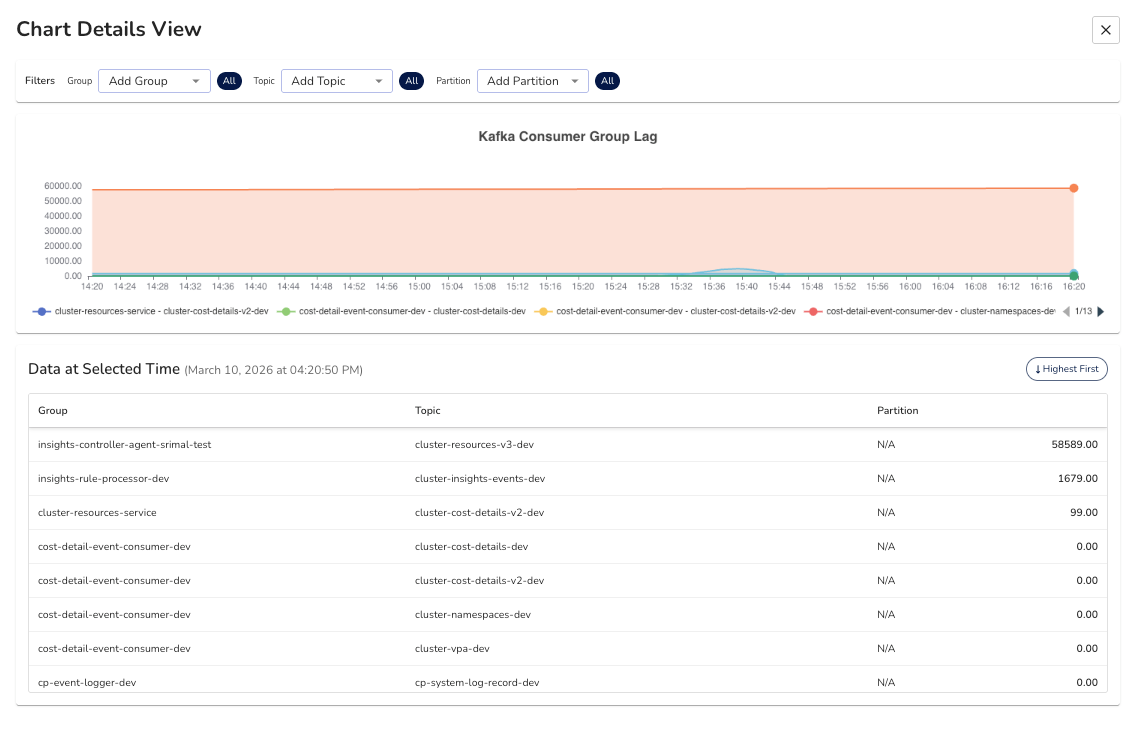
From the broker's perspective, you can see that a consumer group is lagging. What the broker gives you is the consumer group name, the topic, the partition, and the host address of the consumer instance. That's it.
To figure out which application is actually causing the lag, you're typically running the Kafka consumer groups CLI tool, extracting an IP address from the output, then going into your Kubernetes cluster to find which pod maps to that IP. Under normal circumstances that's inconvenient. During a production incident, with pressure mounting and the lag still climbing, it's the kind of process where things get missed.
What you actually need is for that correlation to happen automatically. The broker-side lag being mapped directly to the specific application instance causing it, down to the pod level. That way, when a monitor fires for consumer lag, you already know which service and which instance to look at. No manual digging required.
Beyond consumer group lag itself, consumption rate per consumer instance is worth tracking closely. If you have multiple consumers in a group and their consumption rates are uneven, it usually points to a load distribution problem on the producer side i.e. the messages aren't being spread evenly across partitions, so some consumers are doing significantly more work than others.
Processing latency i.e. how long the application takes to process a single message end to end, is the other key signal. This is an application-side metric, not a broker metric, but it's often the earliest indicator that something is slowing down in your consumer logic before lag becomes visible at the broker level.
The traditional JMX and Prometheus pipeline gives you broker metrics. But as we've seen, broker metrics alone don't prevent 2am incidents. You can see that a broker is healthy while a consumer application is quietly falling behind. You can see that lag exists but not which pod is causing it. The data is there. it's just disconnected.
This is the gap that an OTel-native approach closes.
OpenTelemetry changes the collection architecture in a meaningful way. Instead of a JMX agent scraping metrics directly into Prometheus, you build an OTel collector pipeline that pulls from two sources simultaneously: the JMX metric scraper which gives you a way to query JMX metrics and export them via OTLP (OpenTelemetry vendor-neutral protocol). This can be used for per-broker metrics like request latency, log flush time, and JVM heap usage. Second is the Kafka Metrics receiver for cluster-wide signals like active controller count, under-replicated partitions, and consumer group lag across all topics.
Together, these two receivers give you a complete picture that neither can provide on its own.
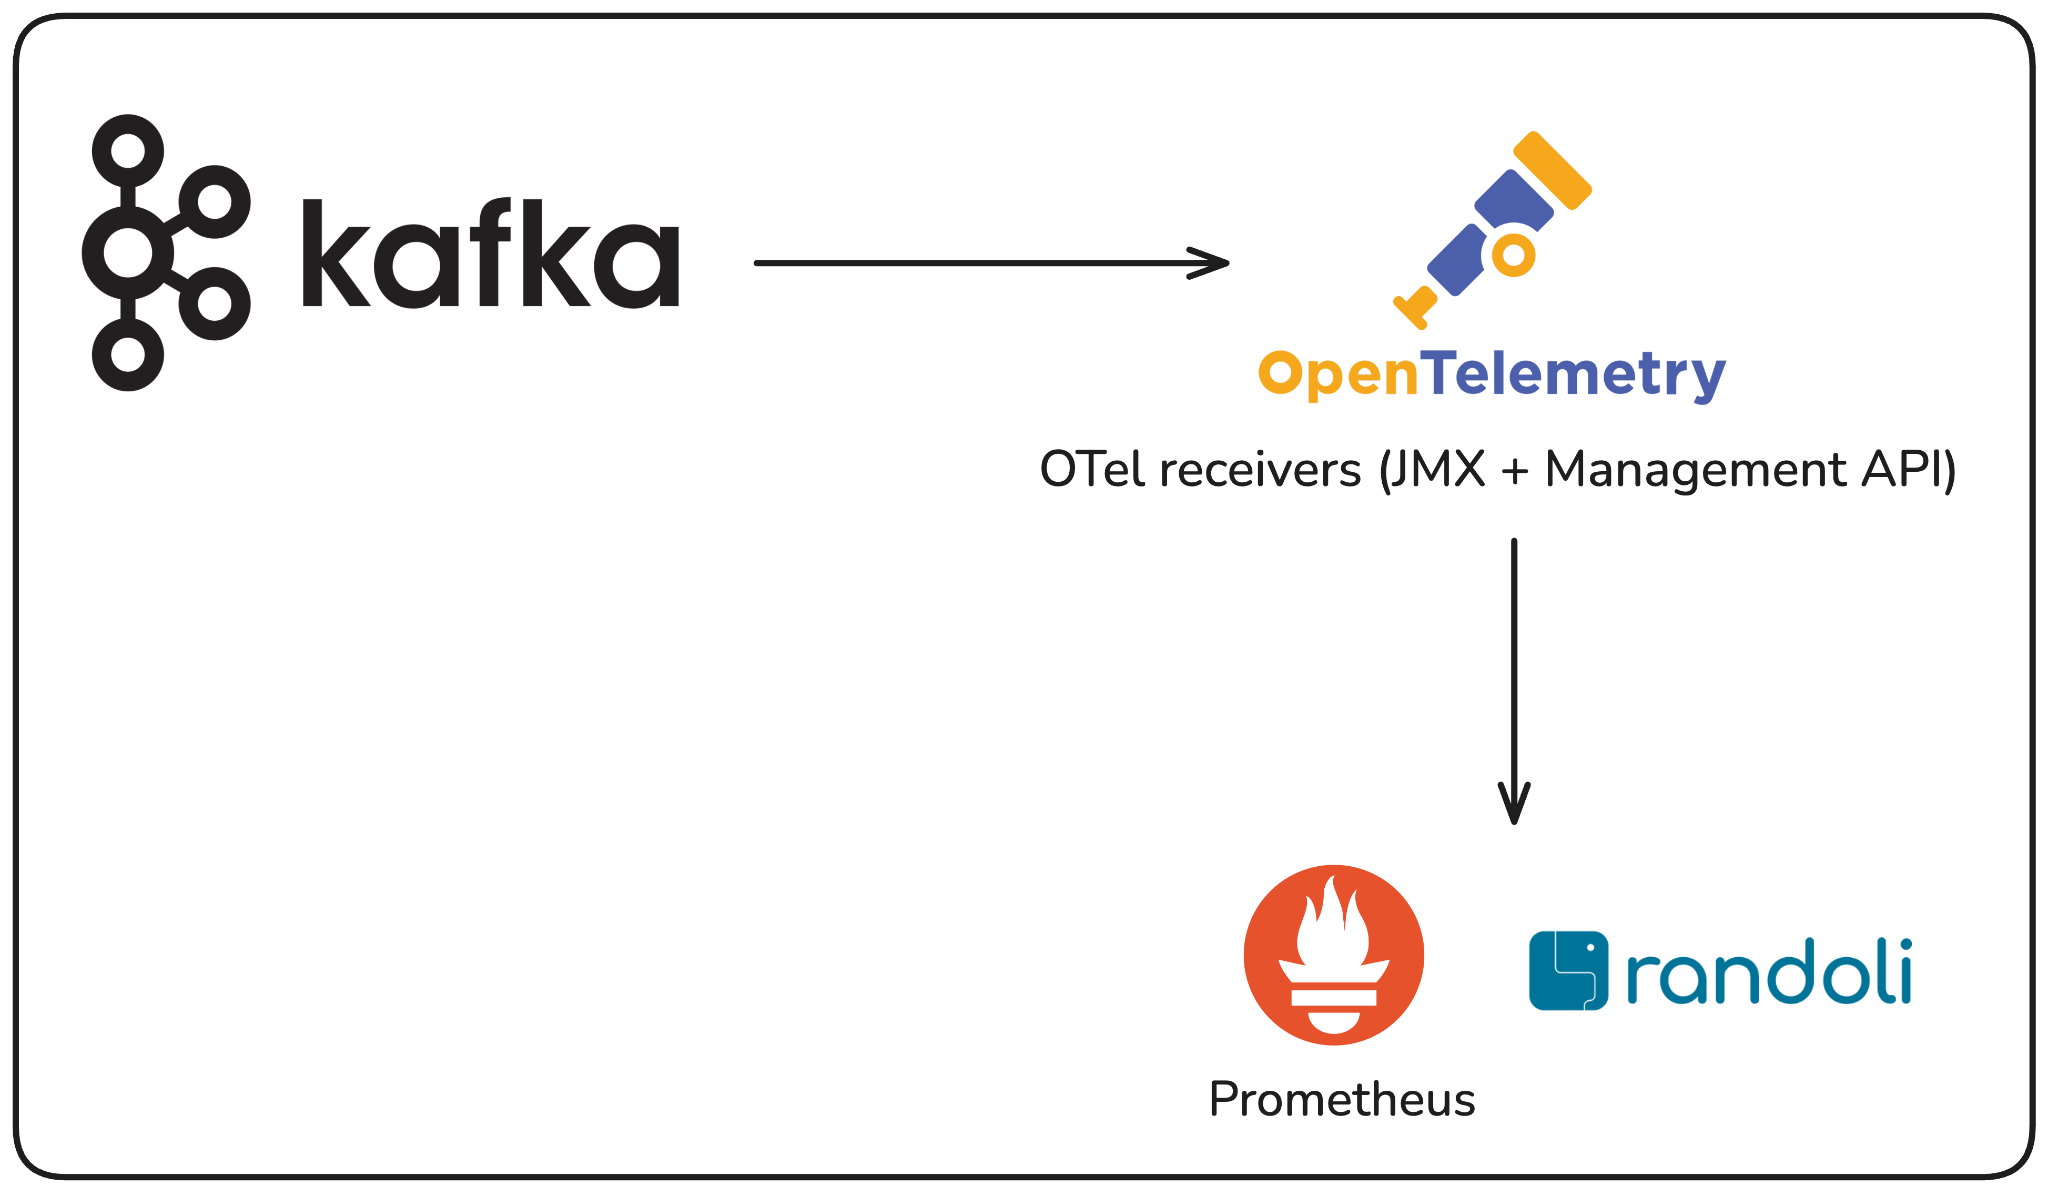
What this means in practice: all of your Kafka telemetry i.e. broker metrics, cluster health, consumer group data, flows through a single unified pipeline, alongside your application metrics, traces, and logs. When something goes wrong, you're not switching between tools or manually correlating an IP address to a pod. Everything is connected in one place.
receivers:

  jmx/broker0:
    jar_path: /otel-jars/opentelemetry-jmx-scraper.jar
    target_system: kafka,jvm
    jmx_configs: /var/conf/jmx-rules/<YOUR_CONFIGMAP_MOUNT_PATH>/kafka-broker.yaml
    endpoint: <KAFKA_BROKER_0_JMX_HOST>:<KAFKA_JMX_PORT>     # e.g. kafka-0.kafka.svc.cluster.local:9999
    collection_interval: 30s
    resource_attributes:
      service.name: <KAFKA_CLUSTER_NAME>                    # e.g. payments-kafka
      service.instance.id: <BROKER_ID_OR_NAME>              # e.g. kafka-0
      match.label: <OPTIONAL_MATCH_LABEL_SELECTOR>

   kafkametrics:
    brokers:
      - "<KAFKA_BROKER_0_HOST>:<KAFKA_BROKER_PORT>"
      - "<KAFKA_BROKER_1_HOST>:<KAFKA_BROKER_PORT>"
      - "<KAFKA_BROKER_2_HOST>:<KAFKA_BROKER_PORT>"
    cluster_alias: <KAFKA_CLUSTER_NAME>
    collection_interval: 15s
    scrapers:
      - brokers
      - topics
      - consumers
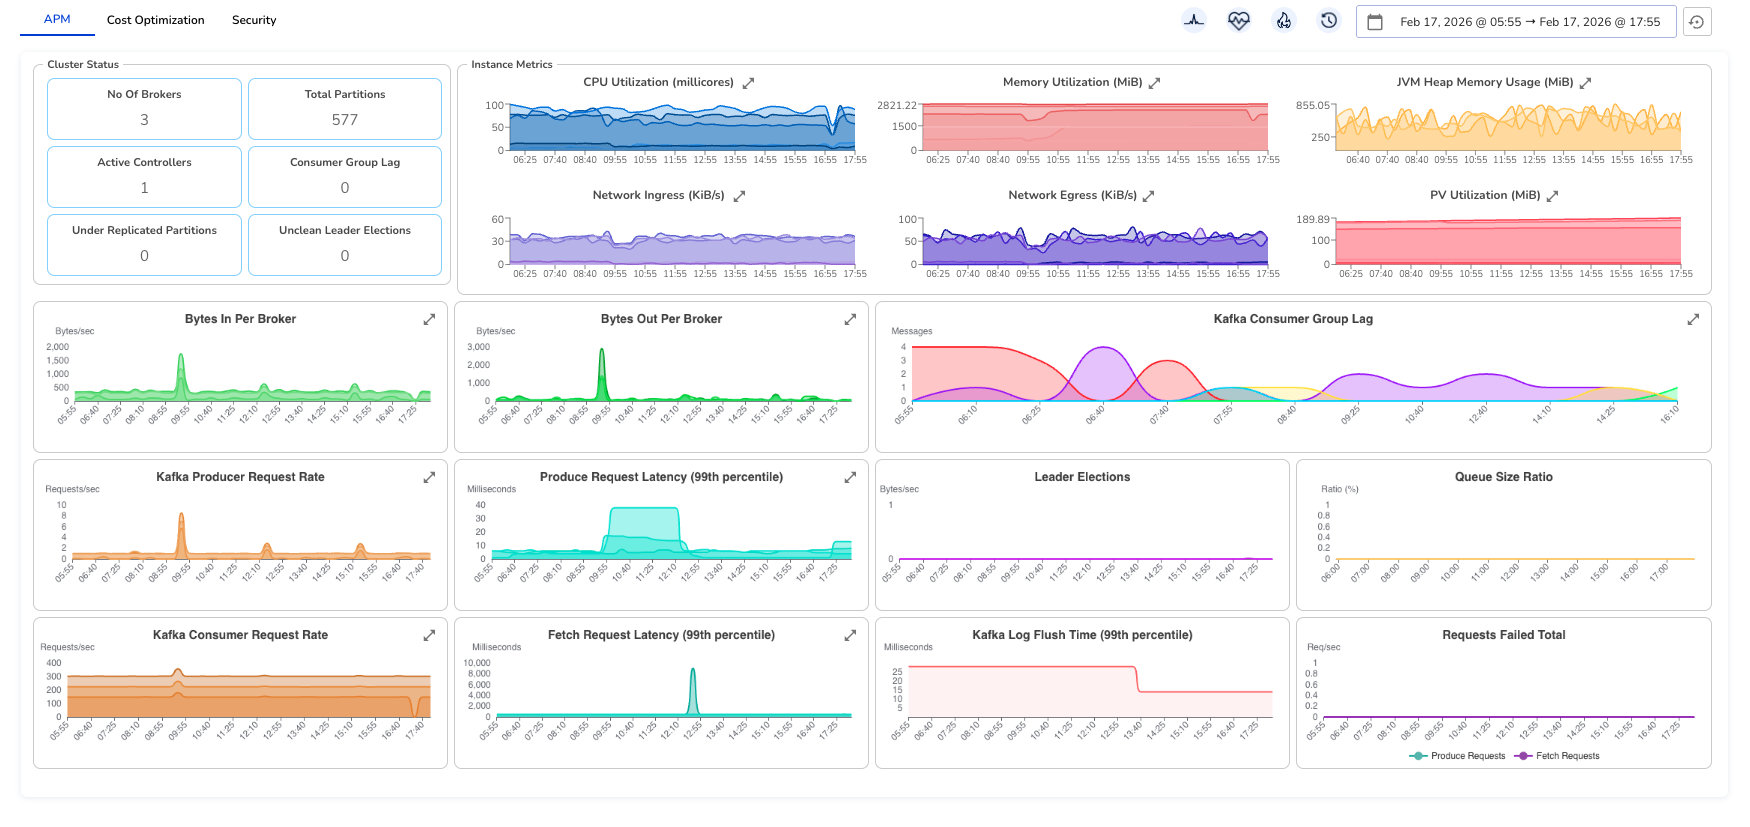
Randoli is built on top of this OTel-native pipeline, with additional configuration that goes beyond what standard JMX exposes. The result is a unified Kafka dashboard that surfaces what actually matters i.e. cluster status, broker performance, consumer lag, latency at the 99th percentile, and PV utilization, all in one view, drillable down to the individual broker or consumer instance level.
The difference this makes becomes clear during an incident. Consumer lag spikes, and instead of starting a manual investigation across three tools, you already know which consumer group is affected, which topic and partition it's consuming from, and which specific application instance is falling behind. That correlation happens automatically through the OTel pipeline. No manual effort required.
That's the shift from traditional monitoring to OTel-native observability: not just more metrics, but the right metrics connected in a way that actually helps you act.
A dashboard tells you what's happening. It doesn't tell you when to act. The difference between catching a problem early and waking up to a 2am incident is often just whether the right alert was configured before things went wrong.
Most teams either rely on generic infrastructure alerts or spend time writing custom Kafka monitors from scratch, both of which leave gaps. Generic alerts miss Kafka-specific failure modes. Custom monitors take time to get right and often get written reactively, after an incident has already happened.
The more reliable approach is having monitors tied directly to the signals that matter for Kafka i.e. minimum broker count, offline partitions, under-replicated partitions, consumer group lag, consumer and producer latency and error rates. Each of these maps to a specific failure scenario we've covered in this blog.
And the thresholds need to reflect your system, a consumer lag threshold of 10 messages might be critical for an order processing service, while a data pipeline might tolerate significantly more.
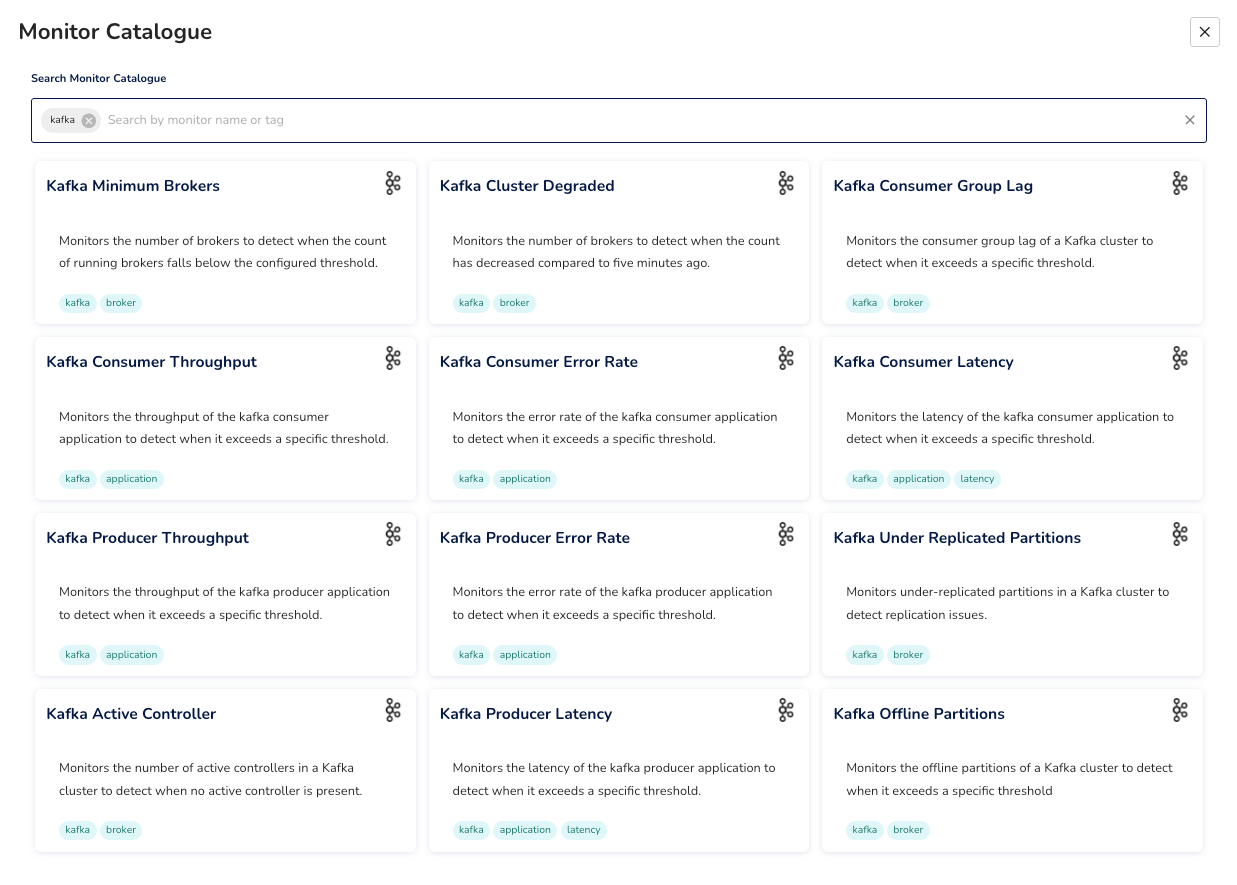
Randoli provides a built-in monitor catalog for Kafka that covers these scenarios out of the box, so you're not starting from scratch. You can configure thresholds to match your requirements, and write custom monitors on top of any metric in the OTel pipeline when your setup needs something more specific.
Metrics show you “the what”. Logs often show you the why, but only if something is actively watching them.
In production, Kafka broker logs contain early warning signals: replication exceptions, ISR warnings, controller errors, that appear long before they surface as metric spikes. By the time the metric moves, the window to act proactively has already closed.
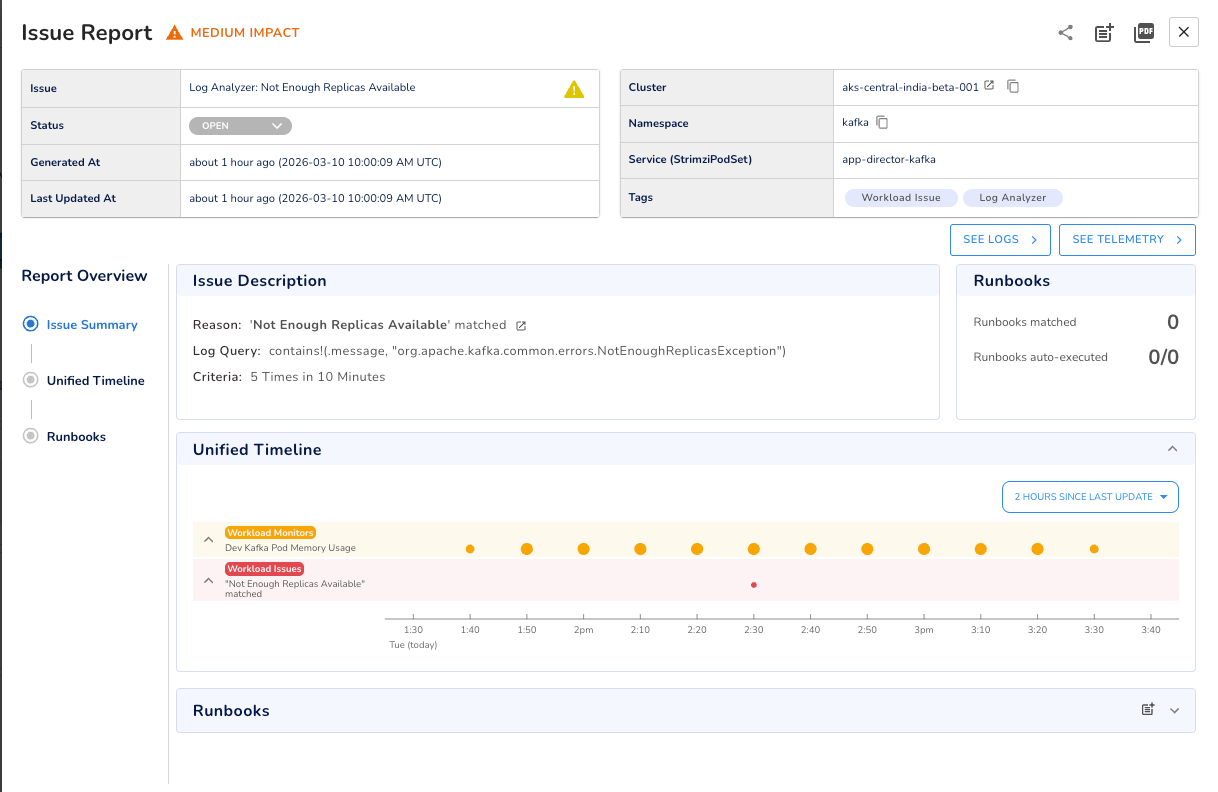
The practical approach is to define the log patterns worth watching, set a threshold and time window, and get alerted when that pattern crosses the threshold. For example, org.apache.kafka.common.errors.NotEnoughReplicasException appearing repeatedly in a short window gives you an early warning of replication pressure that might not yet be visible in your under-replicated partitions metric.
One thing worth building as a habit: when a production incident traces back to a specific log pattern, codify that pattern into a log analyzer going forward. Over time, this turns your incident history into proactive monitoring coverage.
One key differentiator here is that log analysis in Randoli runs entirely inside your own environment. Logs are never sent to an external pipeline, which means no per-GB ingestion costs and no data leaving your infrastructure. Something that matters both operationally and from a compliance standpoint.
The 2am incident we started with isn't a Kafka failure, it's a visibility failure.
Kafka did exactly what it was designed to do. What was missing was the observability layer to catch a slow-moving consumer problem before it became a full-blown outage. Getting that layer right means tracking the metrics that actually signal trouble, correlating broker-side signals to application-level impact, and having monitors in place before something goes wrong, not after.
That's what an OpenTelemetry-native approach to Kafka observability gives you: the right metrics, connected in the right way, with the alerting in place to act before things escalate.
If you want to see what this looks like in practice, you can start a 30-day free trial of Randoli and have your Kafka cluster monitored in minutes.
.png)
.png)


