Monitoring Kafka Metrics with OpenTelemetry
November 12, 2025
Tags:
Observability
OpenTelemetry
Kafka Monitoring
Monitoring Kafka can be a complex responsibility, especially since many of its critical metrics such as replication lag, partition health, and controller activity are exposed through JMX. Depending on the environment, engineers often encounter variations in tooling and setup, which makes achieving consistent visibility a challenge. Ensuring proactive insights into Kafka’s performance therefore requires a standardized and reliable approach.
This is where OpenTelemetry (OTel) comes in. It standardizes Kafka observability, giving you a vendor-neutral, consistent way to collect and export metrics into the backend of your choice.
When it comes to monitoring kafka with OpenTelemetry there are two main ways to approach it:

The above diagram clearly shows how observability is achieved in Kafka from both client and server side perspectives.
In this guide, we will mainly be focused on server-side instrumentation.
Kafka monitoring is essential for tracking broker availability, controller activity, replication status, and partition health to prevent data loss and keep pipelines running reliably at scale. The challenge is that Kafka doesn’t expose metrics in a straightforward way, most are hidden behind JMX, and the rest require extra setup.
To tackle this, Kafka brokers can be instrumented with OpenTelemetry using three primary methods, each offering different levels of metric coverage and configuration effort.
JMX Receiver - The OTel Collector’s JMX receiver scrapes metrics directly from Kafka brokers via their JMX interface.
OpenTelemetry Java Agent - The OTel Java Agent provides zero-code (auto) instrumentation by attaching to the Kafka JVM process.
Kafka Metrics Receiver - Collects metrics exposed by Kafka’s built-in metrics framework via an endpoint or exporter.
In the next sections, we’ll walk through each approach in detail starting with the JMX Receiver.
The JMX Receiver is the most traditional way to instrument Kafka with OpenTelemetry. Kafka exposes its internal metrics covering brokers, topics, partitions, controllers, and replication through Java Management Extensions (JMX). The OTel Collector then receives these metrics and exports them to your chosen backend.
When to use it: Choose this method if you need detailed JVM- and broker-level visibility and you are able to configure the receiver from your OTel collector to pull the metrics.
To enable JMX on kafka brokers , add the following environment variables when initializing your Kafka instance :
export KAFKA_JMX_PORT=9999
export KAFKA_OPTS="-Dcom.sun.management.jmxremote \
  -Dcom.sun.management.jmxremote.port=${KAFKA_JMX_PORT} \
  -Dcom.sun.management.jmxremote.rmi.port=${KAFKA_JMX_PORT} \
  -Dcom.sun.management.jmxremote.authenticate=false \
  -Dcom.sun.management.jmxremote.ssl=false \
  -Djava.rmi.server.hostname=<BROKER_HOST>"
Replace <BROKER_HOSTNAME> with the actual IP or hostname of your Kafka broker.
Here’s a breakdown of these environment variables and how they configure in Kafka broker:
This makes Kafka’s internal metrics available through JMX, so the OTel Collector can receive and export them.
In this step, we configure the OpenTelemetry Collector to scrape Kafka metrics via JMX endpoints.
For this you need JMX Metrics Gatherer JAR, which you can download from the official OpenTelemetry Java Contrib releases page and place the JAR in a directory that is accessible to your Collector process ( example, alongside your Collector binary or within the mounted config directory).
Once the JAR is available on the collector , add the following configuration to your open telemetry collector configuration.
apiVersion: v1
kind: ConfigMap
metadata:
[...]
receivers:
      jmx/broker1:
        endpoint: <broker1-jmx-endpoint>
        target_system: kafka
        collection_interval: 10s
      jmx/broker2:
        endpoint: <broker2-jmx-endpoint>
        target_system: kafka
      jmx/broker3:
        endpoint: <broker3-jmx-endpoint>
        target_system: kafka
    [...]
Lastly add the receives to your pipeline:
service:
 pipelines:
   metrics:
     receivers: [jmx/broker1, jmx/broker2, jmx/broker3 .....]
With JMX enabled, the Collector can now receive and export detailed Kafka metrics. However, this method involves managing JMX ports, which may not fit every environment.
An alternative is to use the OpenTelemetry Java Agent, which runs inside the Kafka JVM and avoids external JMX setup.
The OpenTelemetry Java Agent runs inside the Kafka broker’s JVM process and automatically collects both Kafka and JMX metrics.
Unlike the JMX Receiver, it does not require exposing JMX ports, since the agent operates within the same JVM as the broker itself making it an in-process alternative with simpler networking and deployment.
When to use it: Choose this if you wish to push the metrics to the OTel collector instead of exposing external JMX ports . Although it does require modifying the Kafka instance configuration and may add slight JVM overhead (additional memory/CPU usage)
Download the latest release JAR from the official OpenTelemetry release page.
This ensures the Java Agent JAR is available on your server and ready to be attached during the Kafka instance.
Note : If your kafka brokers are running on kubernetes add your kafka annotations.
The agent is attached to the Kafka process using the -javaagent command line argument, which is passed through the KAFKA_OPTS environment variable as shown below
KAFKA_OPTS:
  -javaagent:/path/to/opentelemetry-javaagent.jar \
  -Dotel.metrics.exporter=otlp \
  -Dotel.exporter.otlp.endpoint=http://<OTEL_COLLECTOR_HOST>:4318 \
  -Dotel.instrumentation.kafka.enabled=true \
  -Dotel.instrumentation.jmx-metrics.enabled=true \
  -Dotel.instrumentation.jmx-metrics.target.system=kafka
  ./bin/kafka-server-start.sh config/server.properties
Replace <OTEL_COLLECTOR_HOST> with the hostname or IP where your OpenTelemetry Collector is running
On the Collector side, you need an OLTP receiver so it can accept metrics from the Java Agent. Create a minimal OpenTelemetry Collector configuration
apiVersion: v1
kind: ConfigMap
metadata:
[...]

receivers:
  otlp:
    protocols:
      http:
      grpc
   [...]

service:
  pipelines:
    metrics:
      receivers: [otlp]
      [...]
       [...]
Once Kafka starts, the Java Agent automatically exports Kafka metrics through OLTP, removing the need to manage JMX endpoints.
While the Java Agent eliminates the need for JMX ports , it also introduces complexity by modifying the Kafka broker instance and running inside the JVM.
For teams that prefer a lightweight setup focused solely on metrics, the Kafka Metrics Receiver offers the most significant option.
The Kafka Metrics Receiver is a purpose-built OpenTelemetry component that collects broker-level metrics directly, without relying on JMX. It’s simpler to configure and avoids JVM-specific settings, making it a lightweight option for Kafka observability.
When to use it: Choose this method if you want the fastest, most lightweight setup and don’t need deep JVM-level details or trace correlation.
Prerequisites:
Ensure that the OpenTelemetry Collector Contrib is installed and ready to run:
1. Host-based installation: Download the binary from the OpenTelemetry releases page This gives you a standalone collector process that can run directly on the host.
2. Docker-based installation: Mount your configuration file when running in a container, e.g.,volumes:./otel-collector-config.yaml:/etc/otel-collector-config.yaml. This ensures the collector picks up your custom scrape and export settings.
The collector will then scrape Kafka metrics and export them to Prometheus or other supported backends.
The first step is to enable the Kafka Metrics Receiver in your OpenTelemetry Collector configuration so that broker metrics can be received and routed to your backend.
apiVersion: v1
kind: ConfigMap
metadata:
[...]

receivers:
  kafkametrics:
    brokers: <Broker_endpoint>:9092
    protocol_version: 2.0.0
    scrapers:
      - brokers
      - topics
      - consumers
[...]
Next, define everything together by creating a service pipeline. This connects the receiver to processors and exporters ( adjust the placeholders as per your setup).
service:
  pipelines:
    metrics:
      receivers: [kafkametrics]
      processors: [...]
      exporters: [...]
telemetry:
    logs:
      level: "debug"
The Collector will now receive metrics from Kafka brokers, topics, and consumers. Metrics are exposed to Prometheus (or any supported backend) for visualization and alerting.
Note: Starting from v0.111.0 of the opentelemetry-collector-contrib, the Kafka Metrics Receiver includes scrapers for brokers, consumers, and topics. Support for additional dimensions such as partitions, producers, and message-level visibility is not yet available.
Once your OpenTelemetry pipelines are configured properly you can configure a Prometheus backend to save it and then you can use dashboards for visualizing and configuring alerts.
Here, we queried kafka_request_count_total to visualize broker request activity:

For a deeper dive into the most critical Kafka monitoring metrics covering broker performance, broker activity, and cluster reliability refer to this Top Kafka Metrics page .
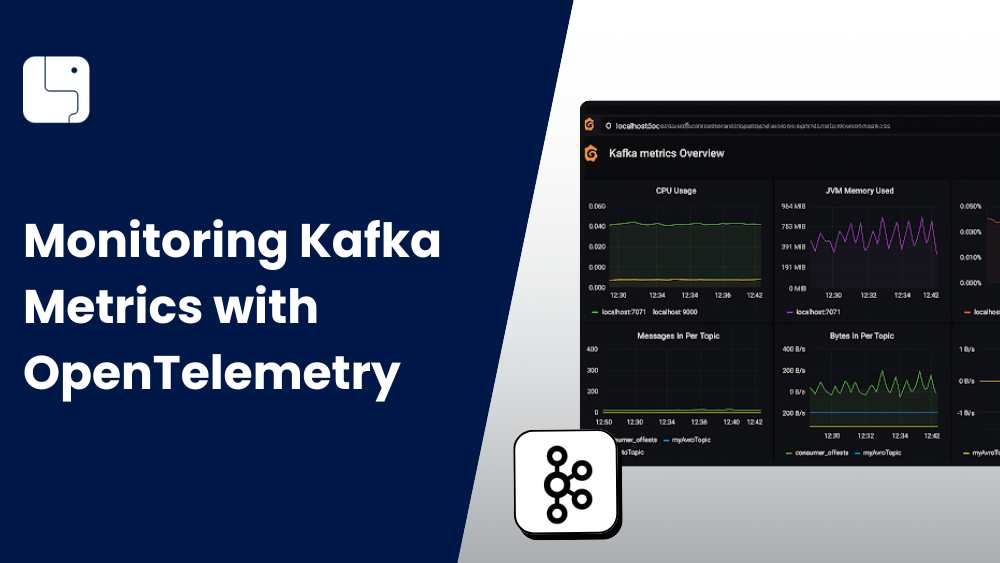
Below is an example of Kafka metrics dashboard in Grafana. You can clearly monitor key metrics such as CPU usage, JVM memory, GC time, and topic-level message flow. For more detailed and customizable dashboards, you can explore the official Grafana dashboards.

For more detailed information you can explore the official Kafka Grafana dashboards.
Now that we’ve seen how the metrics surface in Prometheus and Grafana, the next step is to weigh each of these approaches in terms of operational complexity and observability depth.
This table highlights the differences between all 3 methods for capturing Kafka metrics or telemetry data. Each approach varies in scope, type of data collected, and deployment strategy, as shown below:
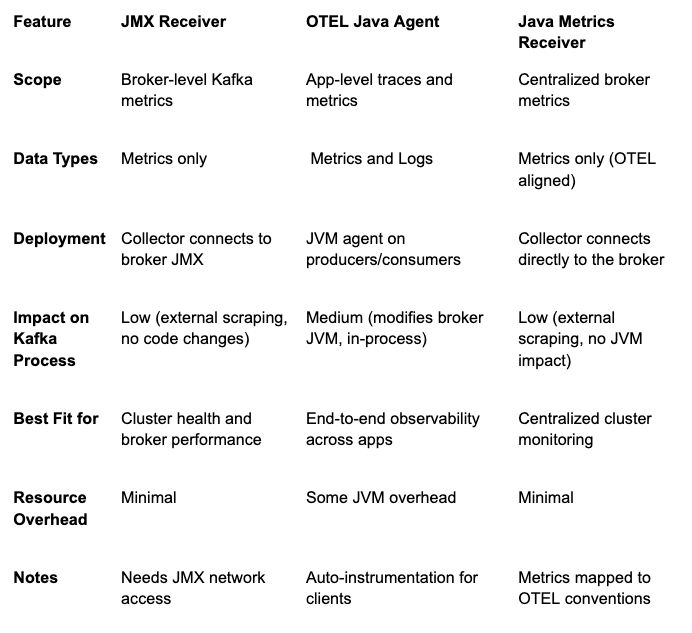
By comparing them side by side, you can identify which option best aligns with your monitoring and observability requirements.
In this guide, we learnt about three approaches to instrumenting Kafka with OpenTelemetry i.e. JMX Receiver, OTel Java Agent, and the Kafka Metrics Receiver. You may choose the right method depending on your operational requirements, deployment model, and performance trade-offs.
Each method differs in how it integrates with Kafka, from an engineering perspective, the choice should align with your reliability goals, automation strategy, and existing monitoring stack.
To learn more check the official OpenTelemetry documentation, the Kafka monitoring guide, and the OTel Collector Contrib GitHub.

.png)


