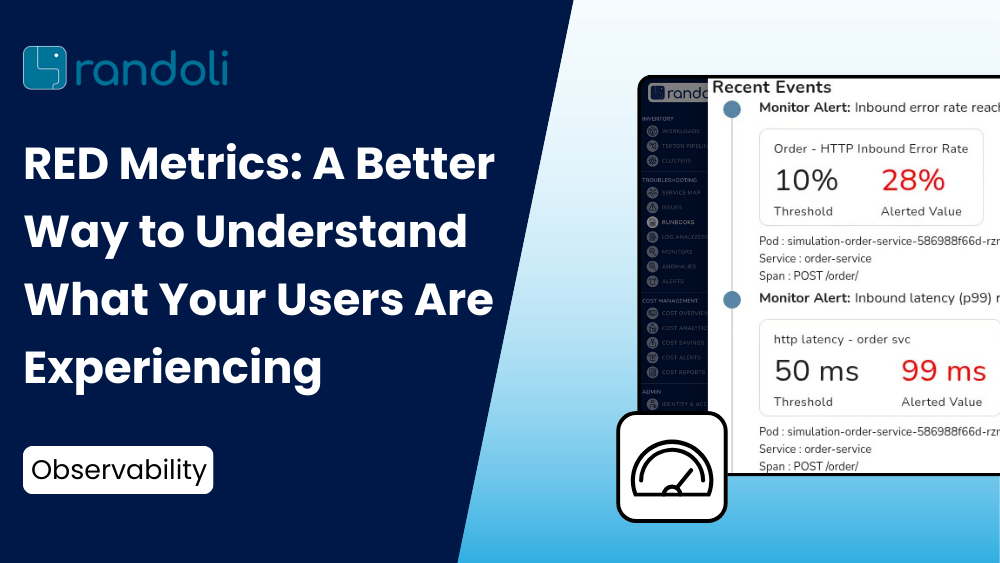
RED Metrics: A Better Way to Understand What Your Users Are Experiencing


When monitoring applications, most teams start with CPU and memory. These are easy to collect and visualize. But while they help you understand system resource usage, they often fail to tell you what really matters:
👉 What is the user experiencing?
In this post, I’ll walk you through a better way to monitor services using RED metrics, and how they can help you move from system-centric to user-centric observability.
RED stands for:
These three dimensions provide direct visibility into the behavior and performance of a request-driven system — as seen by your users.

Let’s say your CPU usage is low and memory looks stable. That might seem fine at first glance — but what if:
These are all user-facing problems that won’t show up in CPU or memory dashboards.
On the flip side, your CPU might be spiking — but if request latency is still low and errors are near-zero, your customers may not even notice.
That’s why RED metrics are essential: they focus on what users actually care about — speed and success.
Let’s take an order service.
You may define two key objectives:
With RED metrics, you can:
These signals help your team react before users are impacted — and fix issues faster when they are.
RED metrics work best when applied to the right level of granularity:
POST /orders, GET /cart)This layered approach lets you build meaningful Service Level Objectives (SLOs) that reflect real user experience — not just server stats.

If you’re using OpenTelemetry traces, you already have the data.
The trick is to enable span metrics, which automatically calculate:
You can export these metrics to:
Once collected, you can:
💡 Span metrics turn distributed traces into a rich source of RED telemetry data — without extra code changes.
If you’re only monitoring infrastructure metrics, you’re flying blind to what really matters.
RED metrics give you a direct window into user experience — they’re the building blocks for effective alerting, debugging, and performance monitoring.
Start by instrumenting a few key operations. Define your thresholds. Set up alerts. Then roll it up into service and journey-level SLOs.
Once you adopt RED metrics, you’ll wonder how you ever operated without them.

.png)