Running OpenCost on OpenShift


Attempting to deploy OpenCost on OpenShift can be a challenging process compared to a standard Kubernetes cluster. Because of the security requirements that OpenShift enforces, there is additional set-up and configuration required for getting OpenCost to function properly.
The goal of this article is to guide you through each of the installation steps to avoid the common issues that occur when OpenCost is installed on OpenShift without being correctly configured. Because of our work testing OpenCost on various different environments, we've gained a ton of experience debugging and resolving these provider-specific problems.
First, we will walk through how to install a Prometheus instance which is a requirement for OpenCost to run. Then, we will go through the actual OpenCost installation and how to configure that properly for OpenShift. We will also go over a few common troubleshooting scenarios you might encounter during this process.
One prerequisite for this guide is installing the Helm CLI. You can find instructions for installing it here before continuing.
Prometheus is a prerequisite for OpenCost as it is used for scraping and generating metrics that are used for cost calculations. By default, OpenShift already has a monitoring stack that includes Prometheus. However, we recommend that you deploy your own instance to avoid difficulties integrating with the already existing instance.
OpenShift deploys Prometheus through their own operator called the Cluster Monitoring Operator which handles their entire monitoring stack. Because of this, Prometheus cannot be configured directly and the options the Cluster Monitoring Operator provides are severely limited. Instead, we will be deploying our own instance that we can configure freely to function with OpenCost.
The first requirement for deploying our own instance of Prometheus is to grant the required permissions for our Prometheus services. You can do so by executing the following command:
kubectl apply -f - <<EOF
apiVersion: rbac.authorization.k8s.io/v1
kind: ClusterRoleBinding
metadata:
name: prometheus-scc-privileged-rolebinding
roleRef:
apiGroup: rbac.authorization.k8s.io
kind: ClusterRole
name: 'system:openshift:scc:privileged'
subjects:
- kind: ServiceAccount
name: prometheus-kube-state-metrics
namespace: opencost
- kind: ServiceAccount
name: prometheus-prometheus-node-exporter
namespace: opencost
---
apiVersion: rbac.authorization.k8s.io/v1
kind: ClusterRoleBinding
metadata:
name: prometheus-scc-hostmount-anyuid-rolebinding
roleRef:
apiGroup: rbac.authorization.k8s.io
kind: ClusterRole
name: 'system:openshift:scc:hostmount-anyuid'
subjects:
- kind: ServiceAccount
name: prometheus-server
namespace: opencost
EOF
The reason these role bindings are required is because of how OpenShift handles container permissions with SecurityContextConstraints. By applying the appropriate SCC roles based on what permissions the container requires to run, the pods will be able to provision and deploy without any issues.
Now that the required permissions have been applied, the next step is to actually install Prometheus through Helm by running the following command:
helm install prometheus --repo https://prometheus-community.github.io/helm-charts prometheus \
--namespace opencost --create-namespace \
--set prometheus-pushgateway.enabled=false \
--set alertmanager.enabled=false \
--set prometheus-node-exporter.service.port=9111 \
--set prometheus-node-exporter.service.targetPort=9111 \
-f https://raw.githubusercontent.com/opencost/opencost/develop/kubernetes/prometheus/extraScrapeConfigs.yaml
There are two important configurations to note here in this command.
First, we explicitly provide the *prometheus-node-exporter* ports instead of using the default values. The reason for this is due to the already existing Prometheus instance as mentioned previously. Because the default Prometheus instance is already occupying those ports, there will be a port conflict that prevents your pods from provisioning properly. Changing the default port values in the Helm chart circumvents this issue.
We also provide an `extraScrapeConfigs.yaml` file when installing Prometheus. These are the contents of the file:
extraScrapeConfigs: |
- job_name: opencost
honor_labels: true
scrape_interval: 1m
scrape_timeout: 10s
metrics_path: /metrics
scheme: http
dns_sd_configs:
- names:
  - opencost.opencost
  type: 'A'
  port: 9003
This scape config is required for the metrics that OpenCost generates to be scraped properly. If this is not configured, OpenCost will not calculate any cost for your cluster.
After installing Prometheus, there might still be some issues that you encounter that prevent Prometheus from working as intended. The following sections address some common problems you can encounter and provide solutions.

One potential issue has to do with the *kubernetes-apiservers* target. If Prometheus is configured to scrape the Kubernetes API Server at a specific IP address, and the TLS certificate is not valid for that address, it will fail with the error shown above.
You can resolve this by modifying the `prometheus-server` Configmap in the namespace you have Prometheus installed. You will want to modify the following job in the config file located at the `prometheus.yml` key:
- bearer_token_file: /var/run/secrets/kubernetes.io/serviceaccount/token
job_name: kubernetes-apiservers
kubernetes_sd_configs:
- role: endpoints
relabel_configs:
- action: keep
regex: default;kubernetes;https
source_labels:
- __meta_kubernetes_namespace
- __meta_kubernetes_service_name
- __meta_kubernetes_endpoint_port_name
- source_labels: [__meta_kubernetes_service_name]
regex: kubernetes
target_label: __address__
replacement: kubernetes.default.svc:443
scheme: https
tls_config:
ca_file: /var/run/secrets/kubernetes.io/serviceaccount/ca.crt
The actual addition we are making is the following section:
- source_labels: [__meta_kubernetes_service_name]
regex: kubernetes
target_label: __address__
replacement: kubernetes.default.svc:443
What this configuration does is replace the target's IP address that we were originally trying to scrape from, with the DNS name of the service. The target will now be scraped properly since we aren't trying to directly access an IP address that is not valid for our TLS certificate.

Every Kubernetes cluster will automatically create a service called *kubernetes* in the *default* namespace that provides access to the API server of that cluster. More information on how this works can be found in the official Kubernetes documentation.
Another target that can have issues scraping is the *kubernetes-service-endpoints* endpoint.
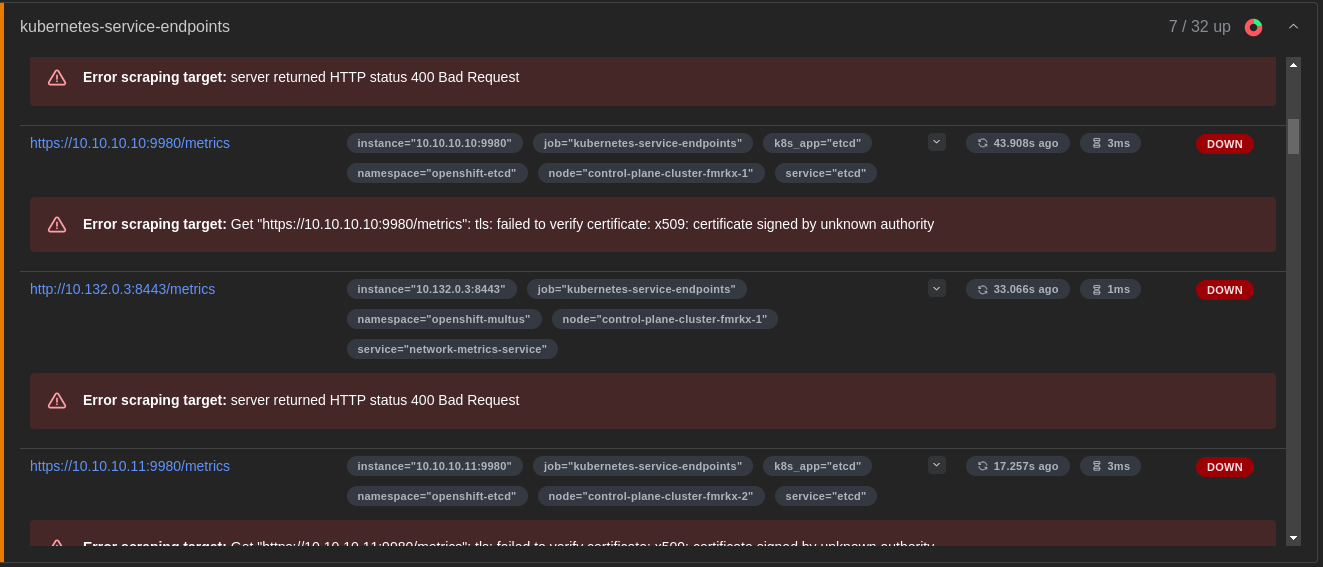
As shown in the above image, there are 7 out of 32 endpoints being scraped properly with the rest failing. The reason this is happening is because of the way Prometheus is configured by default to scrape metrics from every service available on your cluster with the following annotation:
prometheus.io/scrape: 'true'Because of how OpenShift is already set up with a Prometheus monitoring stack by default, this target can become filled with endpoints for core OpenShift services that we do not have permission to access. For OpenCost to function properly, we specifically only care about scraping the *prometheus-node-exporter* and *kube-state-metrics* services we deployed alongside Prometheus.
To resolve this issue, we can again modify the `prometheus.yml` file in our `prometheus-server` Configmap. This time we will want to modify the *kubernetes-service-endpoints* job:
- honor_labels: true
job_name: kubernetes-service-endpoints
kubernetes_sd_configs:
- role: endpoints
relabel_configs:
- action: keep
 regex: true
 source_labels:
 - __meta_kubernetes_service_annotation_prometheus_io_scrape
- action: drop
 regex: true
 source_labels:
 - __meta_kubernetes_service_annotation_prometheus_io_scrape_slow
- action: keep
 regex: opencost
 source_labels:
 - __meta_kubernetes_namespace
The main change we are making is the following:
- action: keep
 regex: opencost
 source_labels:
 - __meta_kubernetes_namespace
The first action under our `relabel_configs` is what filters out all endpoints that don't have the `prometheus.io/scrape: 'true'` annotation. The action we are adding will also filter by the namespace we have specified, which is where our Prometheus instance and other services are deployed.
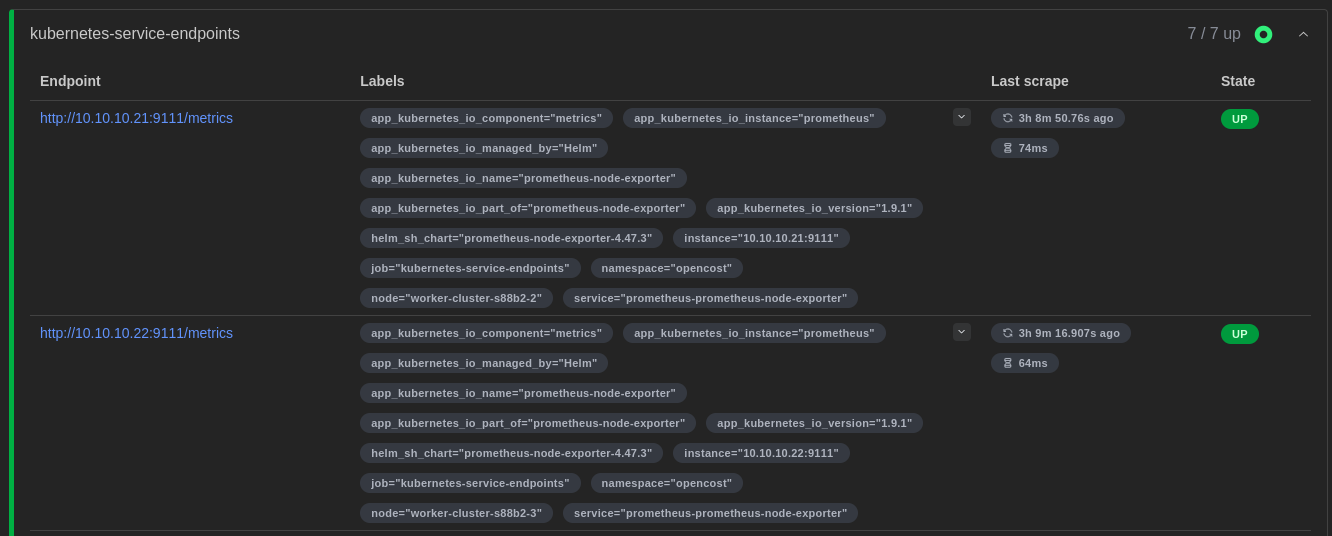
Once we've configured the job with this action, you should only have the necessary endpoints being scraped as shown above.
Now that you have Prometheus installed and configured properly, you can proceed with installing OpenCost. First, you can fetch the latest Helm chart with the following command:
helm repo add opencost-charts https://opencost.github.io/opencost-helm-chart
helm repo update
Once the helm chart has been fetched and updated to the latest version, you can run the following command to install OpenCost:
helm install opencost opencost-charts/opencost --namespace opencost -f opencost-values.yamlThe `opencost-values.yaml` contains all of the configuration required for OpenCost to run on OpenShift.
The contents of the `opencost-values.yaml` file are displayed below:
opencost:
exporter:
  securityContext:
    runAsUser: 1001
prometheus:
  internal:
    namespaceName: opencost
    serviceName: prometheus-server
    port: 80
ui:
  enabled: true
platforms:
  openshift:
    enabled: true
    enableSCC: true
The `prometheus.internal` values specify the Prometheus server endpoint that OpenCost will attempt to query.
The `opencost.exporter.securityContext.runAsUser` value is very important for running on OpenShift. Because of the strict permissions enforced in OpenShift, if you attempt to deploy OpenCost with the default user, the application will fail to properly fetch pricing details due to a filesystem permission error. It is necessary to run as the specified user to avoid this issue.
The other important configuration is the `platforms.openshift` settings. It is not enough to just specify the user to run as in order to avoid this permission error. If you only add the *runAsUser* configuration, OpenCost will fail to provision as the container does not have the required permissions to run as that user.
By setting `openshift.enabled` and `openshift.enableSCC` to true, a custom SecurityContextConstraint and RoleBinding granting those permissions to your OpenCost ServiceAccount is applied to your cluster. This allows your container to be configured with the correct user and to provision properly.
After setting up the configuration file and running the Helm install command, OpenCost should now be running properly on your OpenShift cluster!
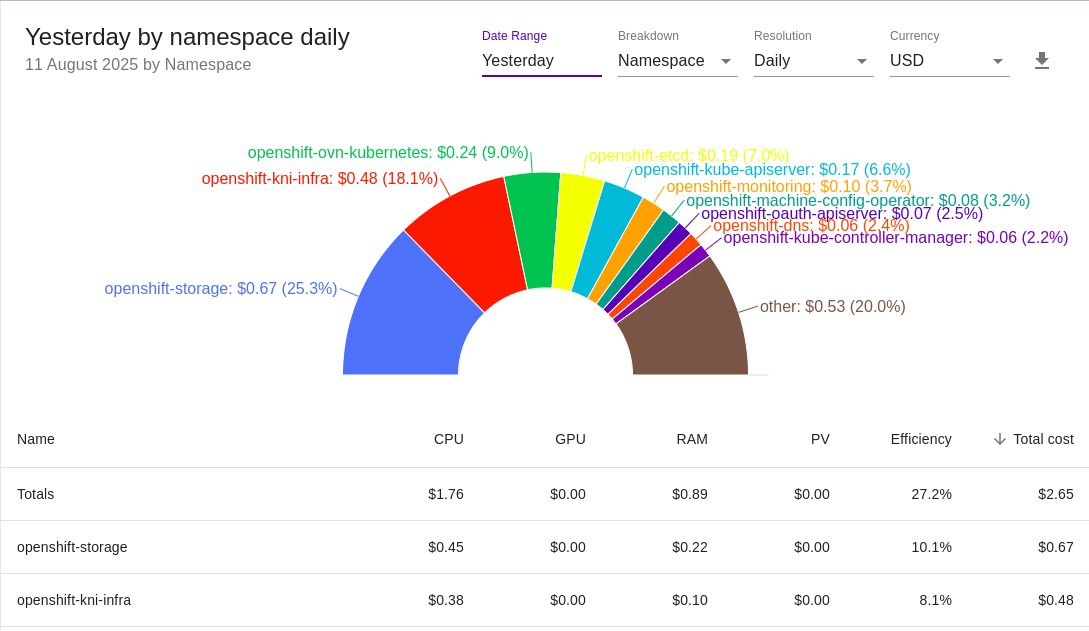
I trust that this guide has assisted you in navigating the common issues and problems that come with configuring Prometheus and OpenCost to work properly on OpenShift.
For a more streamlined installation experience and additional cost management features not provided by OpenCost, I also recommend checking out our Cost Monitoring for Kubernetes product.

.png)