Top Redis Metrics to Monitor in Production Scale Environments
January 18, 2026
Tags:
Observability
OpenTelemetry
Redis Monitoring
.png)
In production, Redis issues rarely appear as hard failures. Instead, teams run into memory fragmentation that wastes usable RAM, aggressive key eviction as maxmemory limits are hit, replicas falling behind during write spikes, and request pauses caused by RDB or AOF rewrite operations. Redis often stays reachable while these problems grow, making the root cause difficult to spot.
Monitoring Redis runtime metrics and consistent visibility into memory efficiency, command execution behavior, replication progress and background persistence activity can help engineers to discover problems before cache hit rates collapse or failovers expose lagging replicas.
Redis sits on the critical request path, and any degradation whether from memory pressure, command delays, replication lag, or persistence overhead directly impacts the applications relying on it.
From an operational perspective, Redis metrics help to answer key questions such as:
Redis performance is shaped by three primary operational pillars :
Proactive visibility into these areas allows teams to detect degradation early, isolate root causes faster, and prevent Redis from becoming a bottleneck or source of cascading latency across the system.
To support this, below are the primary methods for collecting Redis metrics using OpenTelemetry.
Methods of Redis Monitoring with OpenTelemetry
OpenTelemetry (OTel) provides flexible, vendor-neutral approaches to collect Redis metrics, depending on your deployment model, required level of visibility, and acceptable runtime overhead :
1. Client-side (application metrics)
Use OpenTelemetry language SDKs or auto-instrumentation agents to capture Redis command latency, error rates, and request patterns from the application layer.
This helps correlate Redis behavior with application performance.
2. Server-side (Redis runtime metrics)
Use the Redis Receiver in the OpenTelemetry Collector to collect runtime metrics directly from Redis using built-in commands.
This approach is lightweight, easy to operate, and provides visibility into memory usage, command processing, replication, and persistence activity.
Each method differs in setup effort, performance cost, and metric coverage providing a balanced view of system behavior.
To know more checkout detailed Redis Monitoring Blog
To summarize, Redis metrics provide the operational visibility needed to detect performance and stability issues early in production environments.
With that context, we now move on to the key categories of Redis metrics that matter most in production.
Redis metrics can be grouped into categories that reflect memory efficiency, workload pressure, command execution health, replication behavior, and persistence impact. Together, these categories help engineers understand how Redis behaves under real-world load.
Performance metrics describe how efficiently Redis processes commands and responds to client requests. They help teams understand whether Redis is keeping pace with workload demand or introducing latency into application flows.
Suppose application teams begin reporting slower API responses during peak hours, but Redis remains reachable and CPU usage appears normal. Without performance metrics, it’s difficult to determine whether Redis is contributing to the slowdown. By observing command latency and throughput, teams can confirm whether Redis request processing is slowing under load or if the issue originates elsewhere in the stack.
These metrics allow teams to validate runtime responsiveness and detect performance degradation before it impacts user experience.
Core Metrics to Track
latency- Measures the time taken to execute commands and respond to clients.
instantaneous_ops_per_sec- Indicates the current rate of command execution and overall throughput.
cache_hit_ratio- Shows the percentage of requests served from cache, reflecting cache effectiveness.
Memory metrics track how Redis allocates, uses, and reclaims memory. They are critical for identifying memory pressure that can lead to eviction, fragmentation, and reduced cache efficiency.
In a session-heavy workload, Redis memory usage steadily increases until it approaches the configured limit. Soon after, eviction begins and cache hit rates drop, pushing additional load onto downstream databases. Without memory metrics, teams may attribute the slowdown to application behavior rather than Redis itself.
By monitoring memory like usage, fragmentation, and eviction activity, it can be confirmed whether Redis is under memory pressure or wasting usable capacity internally, allowing them for resizing instances, optimizing key sizes, or tuning eviction policies before cache effectiveness degrades further.
Core Metrics to Track
used_memory- Represents total memory currently allocated by Redis.
mem_fragmentation_ratio- Indicates how efficiently memory is being used at the allocator level.
evicted_keys- Counts keys removed due to memory limits, signaling cache pressure.
Activity metrics reflect how clients and replicas interact with Redis. They help identify load patterns, blocking behavior, and synchronization issues that affect runtime stability.
During a traffic surge, Redis begins handling significantly more client connections, and some requests appear to stall. From the application side, this manifests as intermittent delays with no obvious error. Activity metrics reveal whether the increase in connected clients or the presence of blocked clients is contributing to request queuing and slower responses.
These metrics confirm whether Redis is experiencing connection pressure or blocking behavior, helping teams decide whether to tune client usage patterns, reduce blocking operations, or scale Redis capacity to maintain stability.
Core Metrics to Track
connected_clients- Tracks the number of active client connections.
blocked_clients- Indicates clients waiting on blocking commands.
connected_replicas- Shows how many replicas are currently connected to the primary.
Persistence metrics monitor how Redis performs disk-backed operations such as RDB snapshots and AOF rewrites. While these mechanisms ensure durability, they can interfere with request processing if not coordinated carefully with live traffic.
During periods of sustained write activity, teams may notice intermittent latency spikes even though request volume and CPU usage appear stable. From the application perspective, responses slow down without clear errors or traffic surges. Persistence metrics indicate whether durability operations overlap with peak write workloads and affect runtime performance.
Giving a clear view of whether durability operations are competing with foreground command execution, allowing teams to tune rewrite thresholds, adjust persistence strategies, or offload persistence workloads to replicas to reduce runtime impact.
Core Metrics to Track
rdb_last_save_time- Timestamp of the last successful RDB snapshot.
rdb_changes_since_last_save- Tracks write activity since the previous snapshot.
aof_rewrite_in_progress- Indicates whether an AOF rewrite operation is currently running.
Error and reliability metrics surface failures that directly affect client connectivity and data availability. They help teams determine whether Redis itself is the source of access issues or degraded behavior observed by applications.
For example as traffic grows, applications may begin experiencing intermittent connection failures or an increase in cache misses, often without obvious infrastructure errors. From the outside, this can resemble network instability or client-side bugs. Reliability metrics expose whether Redis is rejecting connections due to client limits or failing to serve expected keys.
These metrics confirm whether Redis is under capacity stress or serving degraded responses, enabling teams to adjust client limits, plan capacity increases, or improve cache usage patterns before reliability issues escalate.
Core Metrics to Track
rejected_connections- Counts connections refused due to reaching client limits.
keyspace_misses- Tracks failed key lookups, indicating cache inefficiency.
replication_lag- Measures delay between primary and replica data synchronization.
Resource and availability metrics track the underlying health of the Redis process and its ability to remain stable under load. These metrics help teams identify saturation, restarts, or infrastructure-level disruptions.
A Redis instance unexpectedly restarts during peak traffic, causing a brief but widespread increase in application latency. Resource metrics show elevated CPU usage and unusual network behavior leading up to the restart.
By correlating these signals, teams can confirm whether resource saturation or infrastructure instability triggered the restart, enabling proactive capacity planning and preventing repeat incidents.
Core Metrics to Track
cpu_usage - Measures CPU consumption by the Redis server.
net_input_bytes / net_output_bytes- Tracks inbound and outbound network traffic.
uptime_seconds- Indicates how long Redis has been running, helping detect unexpected restarts.
Up next, we’ll focus on the Redis signals that matter most for real-time operational visibility.
Redis exposes dozens of metrics, but a focused set provides the most operational value and determines whether a Redis deployment remains stable, responsive, and predictable under production load.
These ten metrics surface critical runtime signals across Redis execution behaviour , resource usage, failure readiness and durability workflows, making them essential for production monitoring.
Tracking these metrics together provides clear visibility into how Redis behaves under pressure and allows teams to identify risk patterns before they escalate into application-facing incidents.
Next, we’ll analyse how these metrics are visualized in real-time environments .
Redis metrics can be visualized through monitoring dashboards to observe runtime behavior and resource utilization in real time. That helps to move beyond raw counters and understand how Redis responds to workload changes, memory pressure, and client activity as they happen.
Below is an example of Redis metrics visualized using the Randoli dashboard, bringing together key runtime signals discussed earlier.
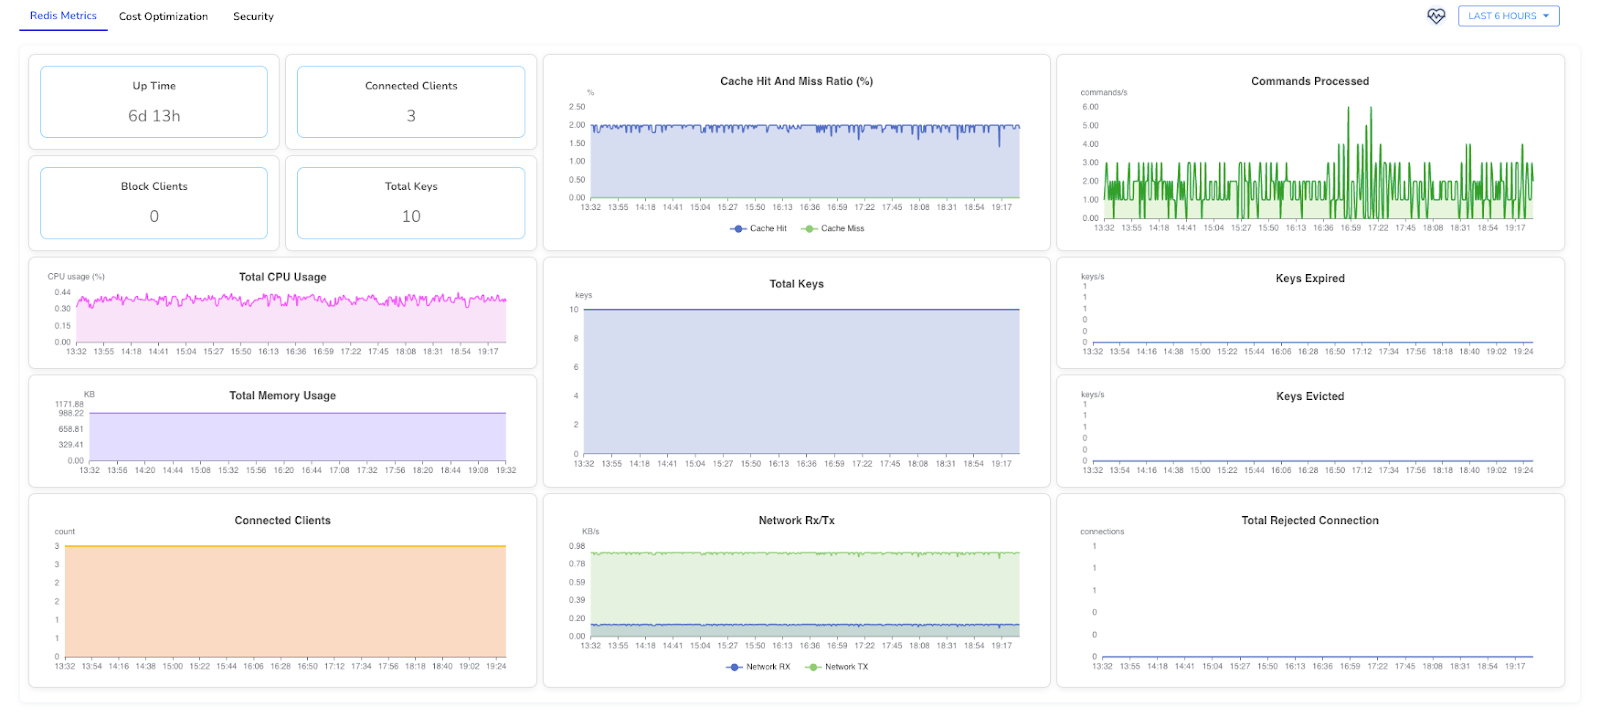
This dashboard highlights operational indicators such as :
By correlating these metrics in a single view, teams can quickly distinguish between application-driven load, Redis-side constraints and infrastructure-level constraints, enabling faster diagnosis and more confident operational decisions.
For a complete overview of available Redis metrics and their definitions, refer to the documentation.
Maintaining Redis stability in production is less about tracking every available metric and more about observing the signals that indicate pressure, imbalance, or emerging failure conditions.
By monitoring runtime indicators such as “memory utilization trends, command execution behavior, replication readiness, and persistence activity” teams can identify degradation early and address issues before they surface as application latency, cache inefficiency, or failover risk.
The objective goes beyond basic observability. It is about maintaining consistent performance, reducing operational surprises, and ensuring Redis remains a dependable component of distributed systems at scale.
To explore Redis instrumentation using OpenTelemetry in more detail, refer to the Redis monitoring documentation.

.png)


