How to Make GenAI Costs Observable in Production
February 10, 2026
Tags:
Cost Management
Generative AI
Best Practices
.png)
Once GenAI systems move into production, most teams reach the same realization: the problem isn’t just that costs are high, it’s that they’re hard to reason about. Certain features cost more than expected, bills fluctuate without obvious traffic changes, and questions about spend can’t be answered by looking at billing dashboards alone.
In the previous post, we broke down the most common visibility gaps that cause GenAI costs to feel unpredictable at scale. In this one, we’ll shift focus to what teams do once they recognize those gaps.
We’ll walk through a set of practical strategies teams use in production to regain control over GenAI spend by treating cost as an operational signal, designing the right telemetry, and closing the feedback loop between engineering and finance before the next spike shows up on a bill.
In traditional, non-AI systems, teams understand cost by understanding system behavior. Metrics, traces, and logs show how the application behaves at runtime, and cost follows from that behavior.
As we saw in the previous post, GenAI breaks this model. The signals that actually drive cost: token usage, model selection, retries, prompt structure, rarely show up in standard observability pipelines, leaving teams with outcomes but no insight into the behavior that produced them.
The shift teams need to make is simple, but not trivial: GenAI cost has to be made observable. That means treating cost drivers as operational signals, capturing them where they originate inside the application, and reasoning about them the same way teams reason about performance or reliability.
The strategies we’re talking about today are all built around closing this gap between how GenAI systems behave in production and how their costs show up after the fact.
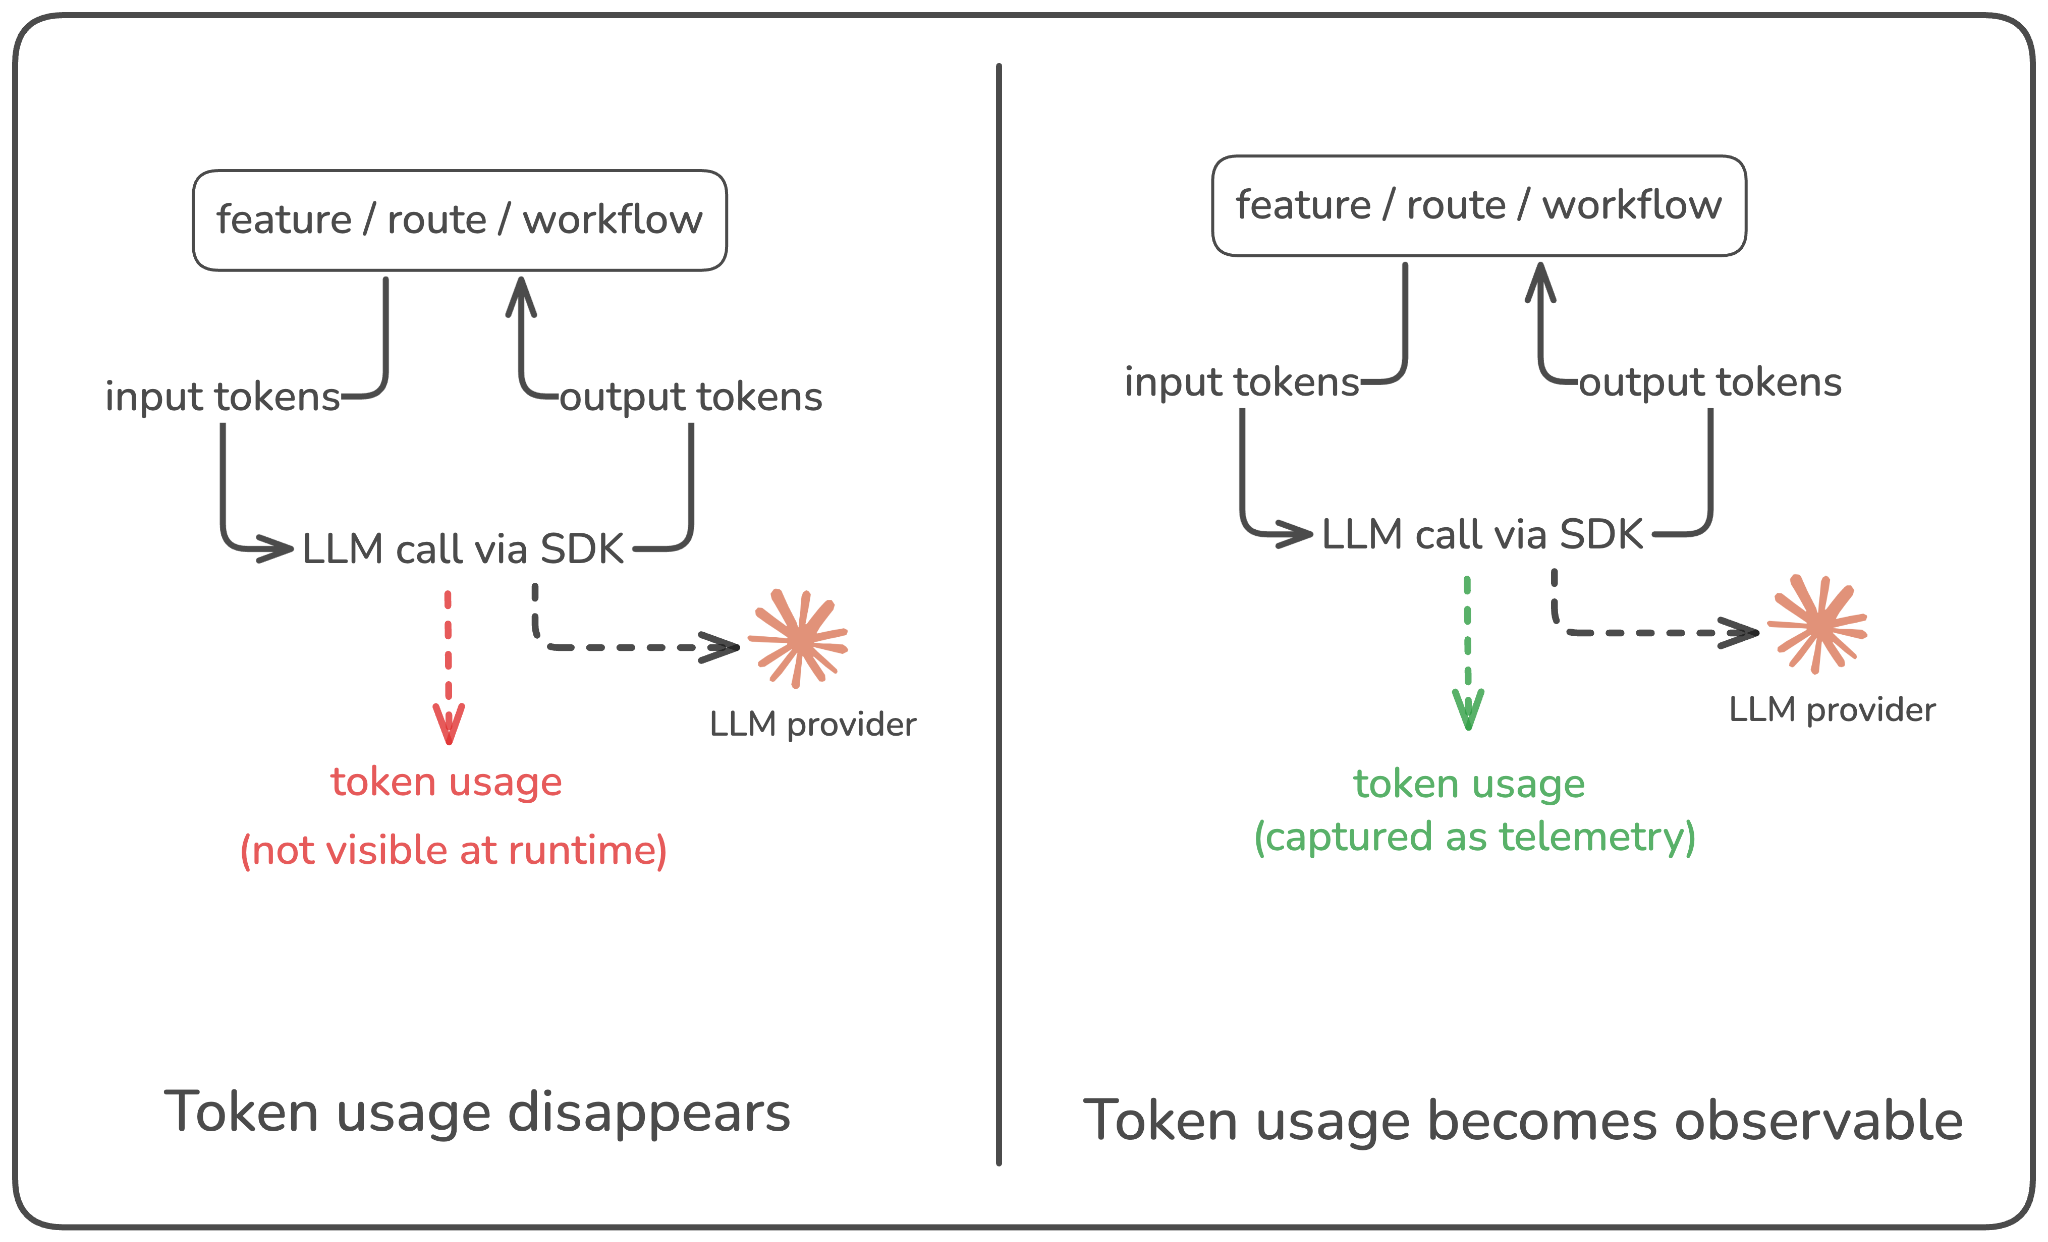
In most production systems today, teams know exactly how to reason about latency, error rates, or throughput because those signals are emitted directly by the application as it runs. Token usage, however, rarely gets the same treatment. It’s often hidden behind SDKs, aggregated at the provider level, or only visible later through billing reports.
That means the single unit that directly drives GenAI cost never shows up where you actually operate the system.
The first shift you need to make is to treat token usage as a runtime signal, not a financial afterthought. Instead of only asking “how much did this model cost us last month?”, you want to be able to answer questions like: how many tokens does this request consume, which feature or workflow triggered them, and how does that change when application behavior changes? Seeing token usage at the point where it originates i.e. inside your application logic, is what connects everyday engineering decisions to cost.
Consider a simple example here. You ship a small prompt change to improve response quality in a user-facing feature. There’s no traffic spike, latency looks fine, and error rates are stable. A week later, the GenAI bill is noticeably higher. Without token-level visibility in production, all you see is the outcome. With it, you can see that the average output tokens per request quietly doubled after the deploy. The problem isn’t hidden anymore, and neither is the fix.
The goal at this stage isn’t optimization. It’s visibility. Once token usage is observable alongside other production signals, patterns that were previously invisible start to surface: prompts that consistently generate longer responses, retries that quietly double usage, etc. This is the foundation everything else builds on.
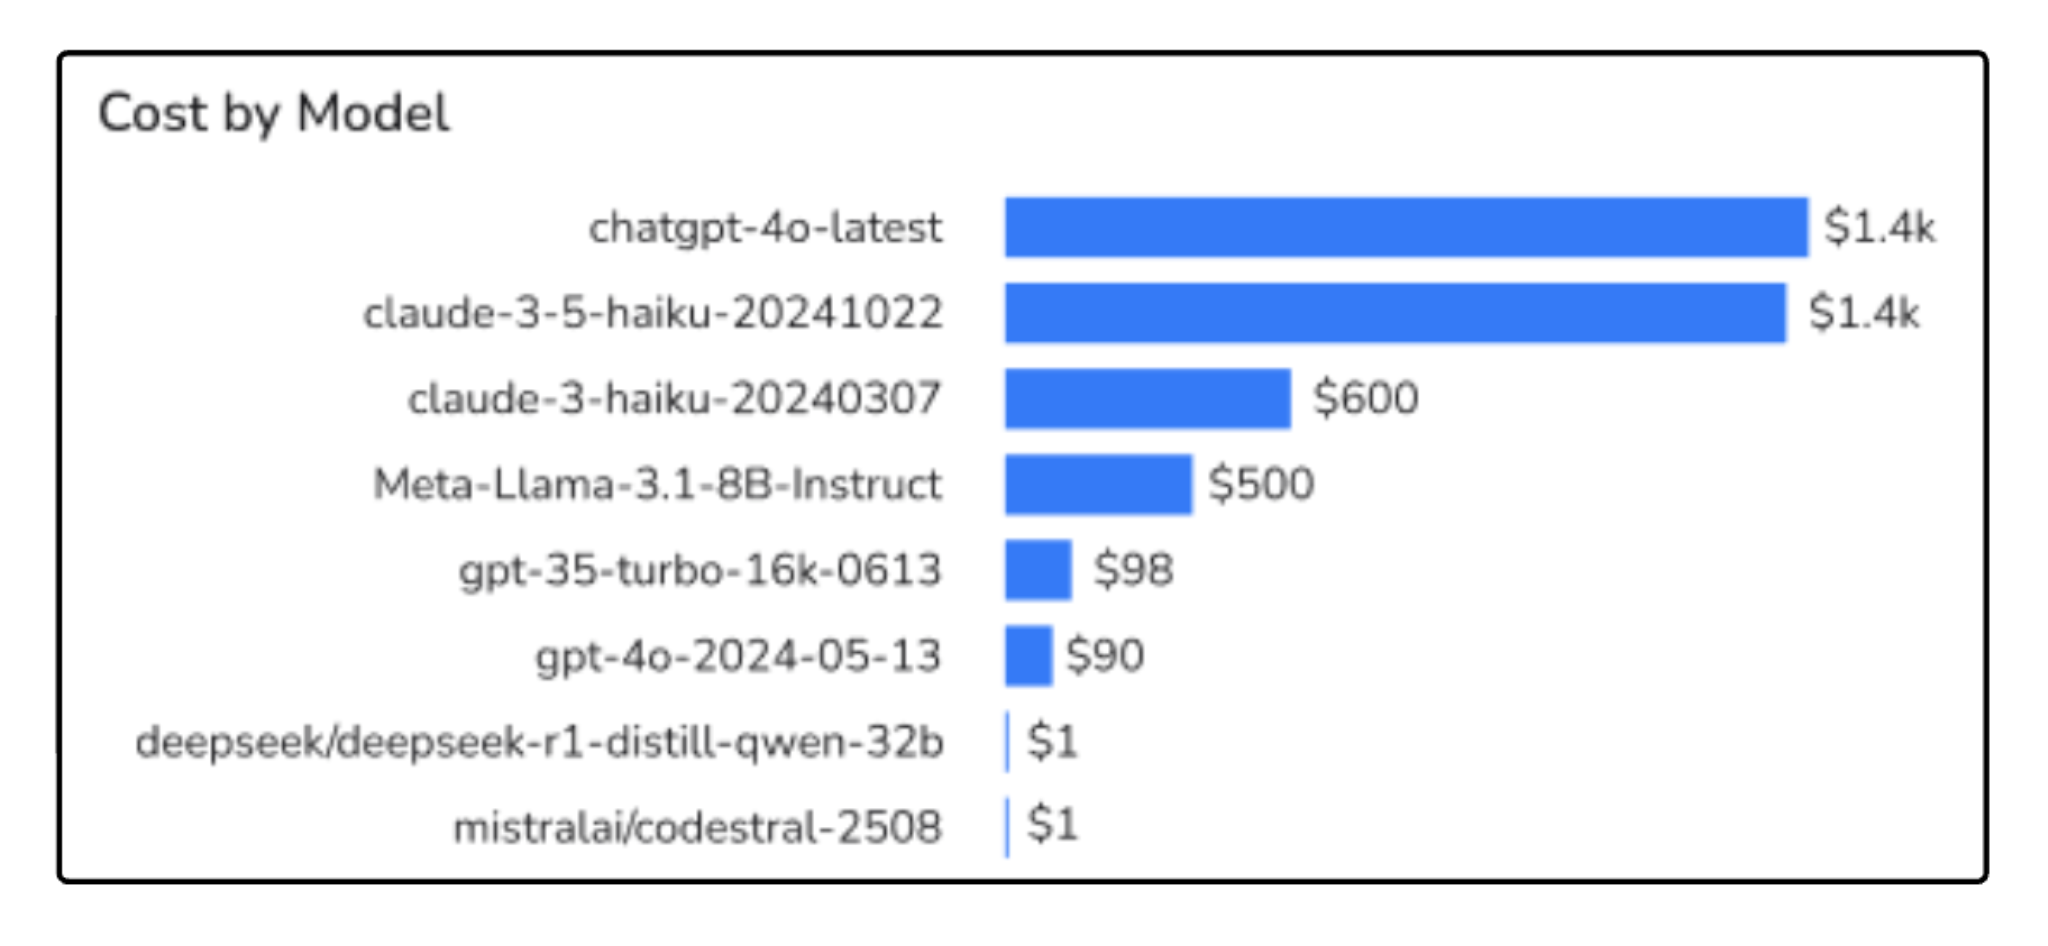
In production, GenAI usage rarely flows through a single model for long. You might start with one default model, but over time you add fallbacks, try new versions, route different workflows to different models, or ship a “quality improvement” that quietly changes which model gets used. If you only look at cost at the provider level (“OpenAI spend” or “Anthropic spend”), all of that gets blurred together, and you lose the ability to answer a basic question: which models are actually driving the most spend?
The shift here is to make “model” a first-class dimension in how you track cost. You want to be able to break down usage and spend by provider + model + version, and see how that mix changes over time. Otherwise, cost increases turn into debates. Finance sees a higher bill, engineering knows “we use a few models,” but no one can point to what changed: did a routing rule favor a more expensive model, did a new version roll out gradually, or did a fallback path become more common?
A common pattern looks like this: you introduce a fallback to a stronger model for edge cases, or you upgrade a model version for one feature to improve output quality. Traffic stays flat and latency still looks fine, so nothing looks wrong operationally. But over the next couple of weeks, more requests start taking that path than you expected, and spend increases gradually.
If you can see cost by model, the story becomes obvious early: usage shifted toward the expensive model, and you can decide whether to tune routing, tighten thresholds, or reserve that model for only the requests that truly need it.
Even when you can see which models are driving costs, the next question is usually harder to answer: where is that usage actually coming from?
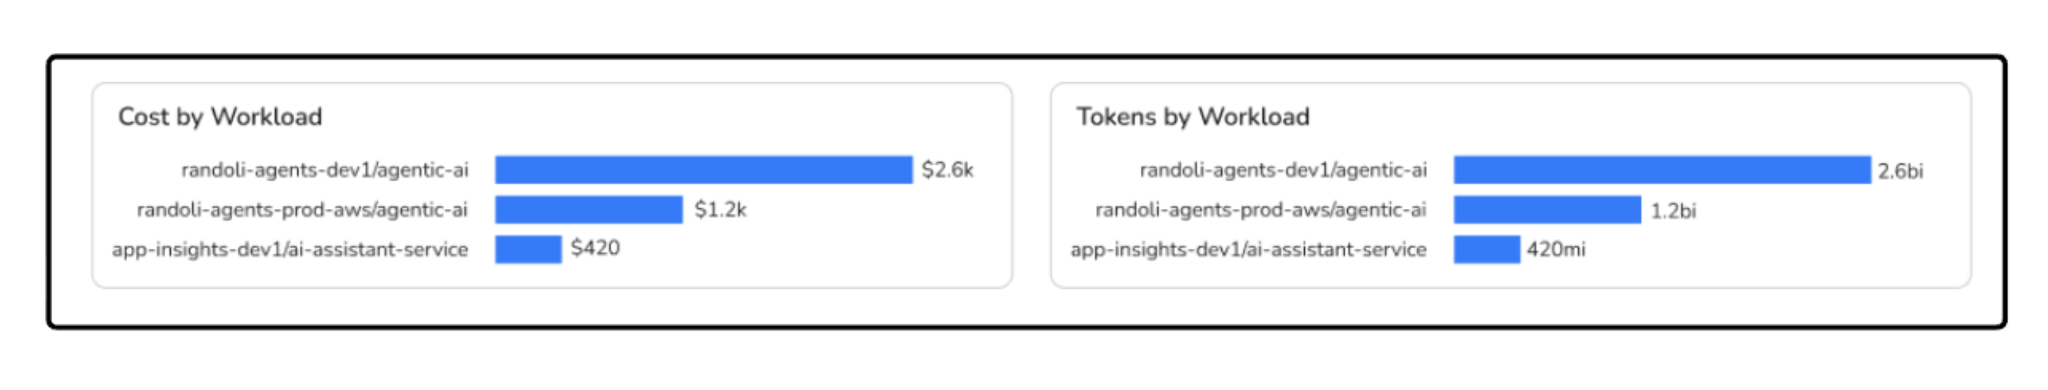
Most GenAI billing is still aggregated at the provider account or API key level. That tells you how much you spent, but not which service, workflow, or feature was responsible. In production, that gap quickly becomes a blocker.
What you need instead is workload-level attribution. That means being able to tie GenAI usage back to the same things you already use to reason about systems in production: services, environments, routes, background jobs, or user workflows. When cost is attributed this way, conversations change. Instead of asking “why did our GenAI bill go up?”, you can ask “which service or feature is driving this, and why?”, and those are questions engineering teams can actually act on.
Without this context, cost optimization turns into guesswork. A FinOps team might see that a model is responsible for a large chunk of spend, but without knowing which workloads are calling it, there’s no clear path forward. Should you cache responses? Restrict usage in staging? Change prompts for a specific flow?
Workload-level attribution is what turns GenAI cost from a shared black box into an owned, debuggable problem.
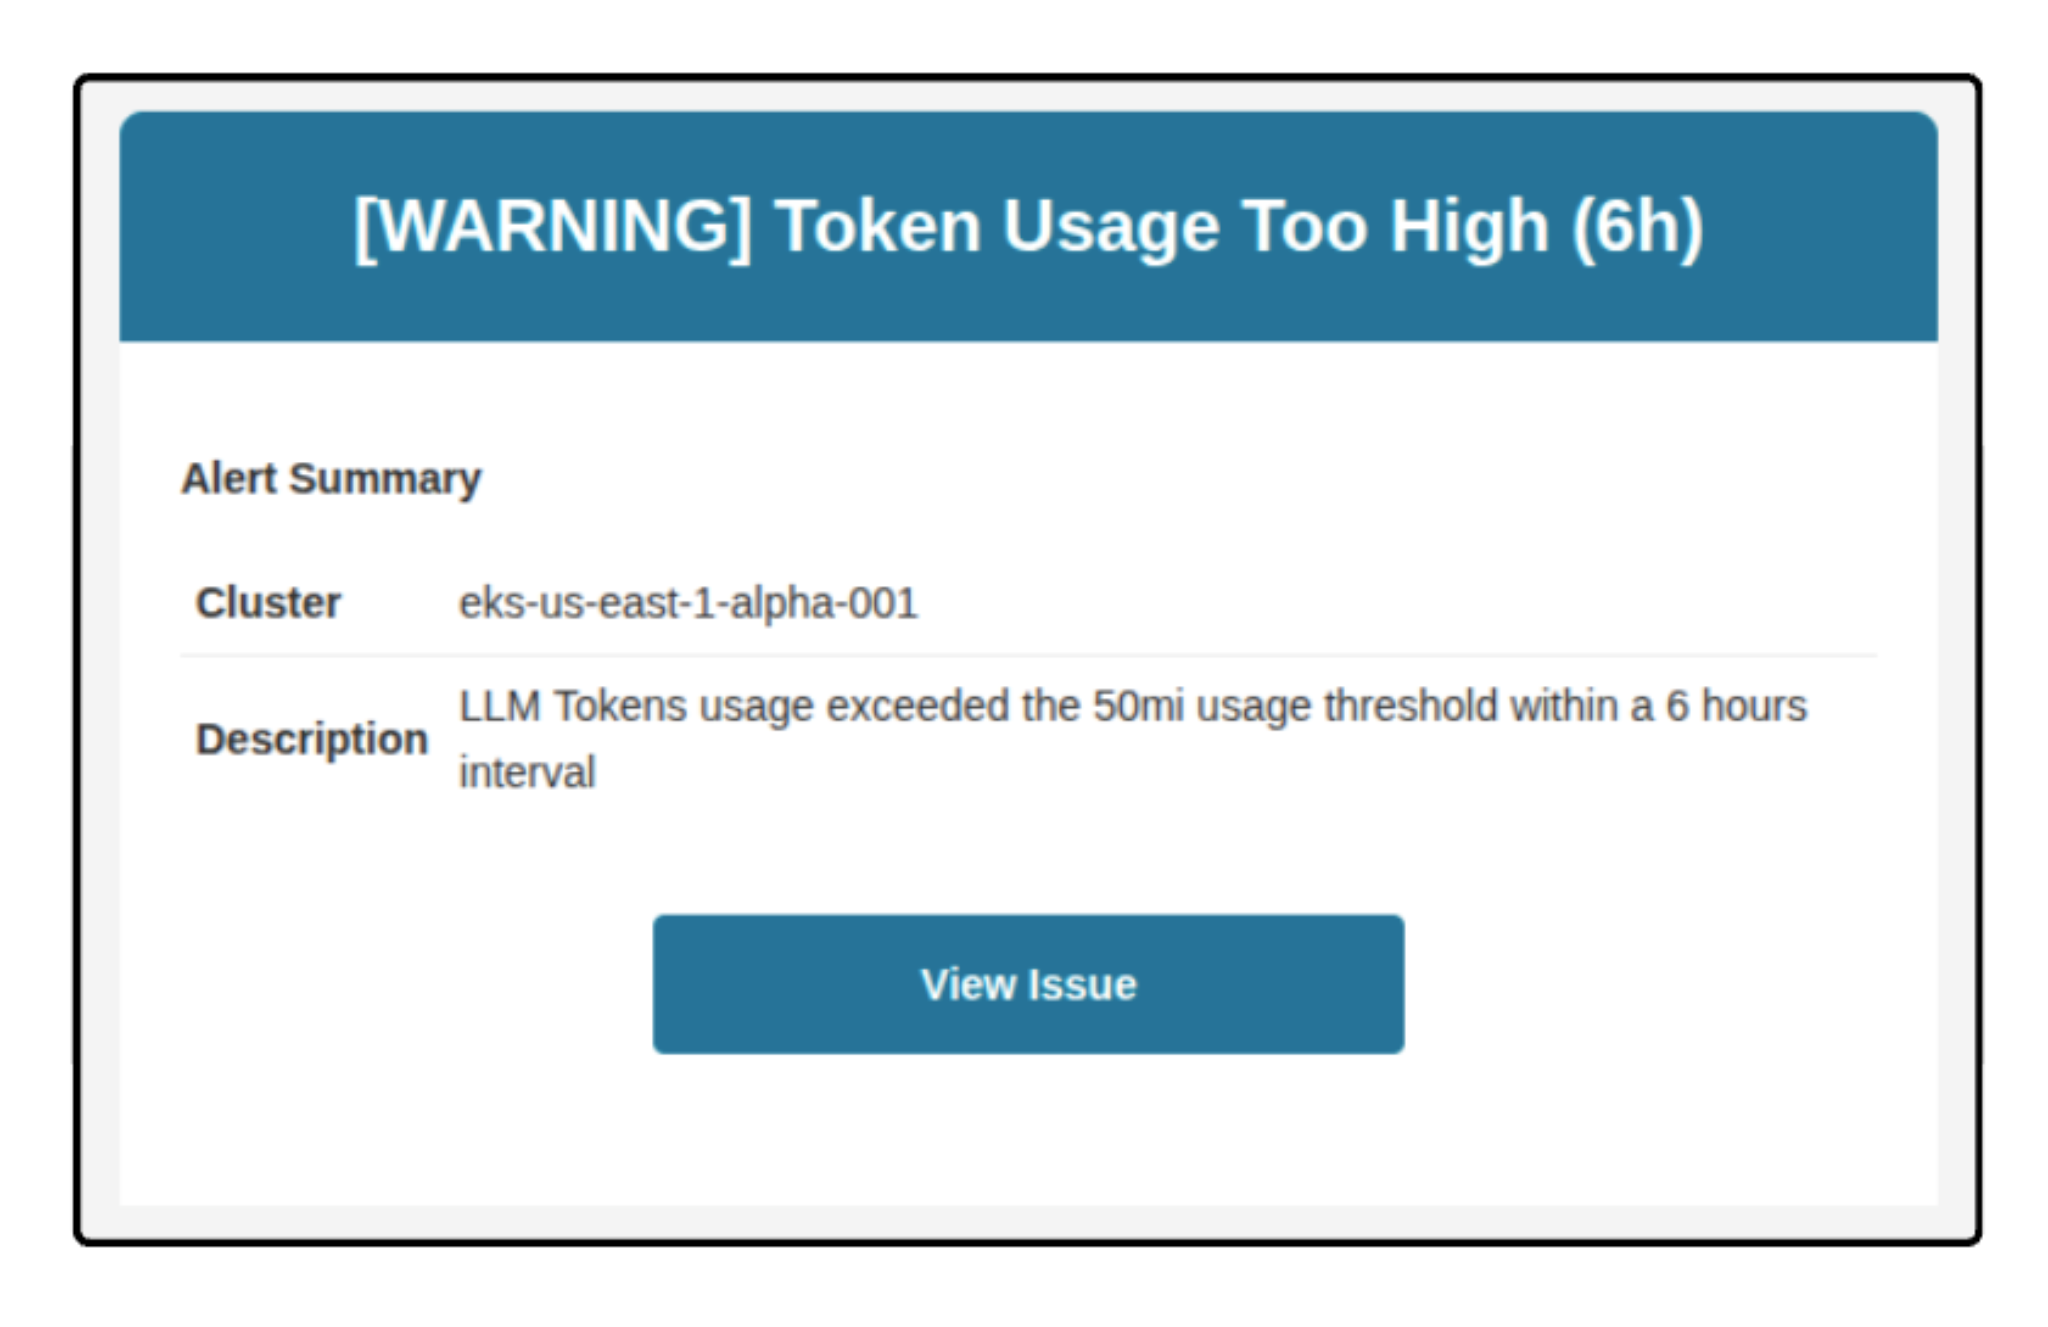
One of the biggest reasons GenAI costs feel hard to control is timing. By the time a spike shows up in a billing dashboard, the usage pattern that caused it is already old.
A prompt change, a routing tweak, or an increase in retries may have been happening quietly for days or weeks before anyone notices. At that point, you’re no longer preventing a problem, you’re doing a post-mortem.
The way out is to shorten the feedback loop. Instead of relying on delayed billing data, you want alerts tied to real usage signals: sudden changes in token consumption, unexpected shifts in model mix, or cost growth that’s out of line with traffic.
When cost anomalies surface while the system is running, you can correlate them with deploys, config changes, or workflow behavior and respond early. Cost stops being a surprise and starts behaving like any other production signal you’re already used to managing.
When something goes wrong in production, let's say latency spikes or error rate increase, your first instinct isn’t to open a billing dashboard. You look at deploys, traces, metrics, and logs and try to understand what changed. GenAI cost needs to work the same way.
What makes the difference is being able to investigate GenAI cost where you already debug systems. When token usage, model selection, and cost-related signals can be viewed alongside deploys, routes, retries, and workflow traces, cost stops being a separate concern.
A spike becomes something you can correlate to a prompt change, a new fallback path, or an increase in background jobs. Instead of guessing after the fact, you can reason about GenAI cost as part of how the system behaves in production.
Taken together, these strategies point to a consistent pattern. GenAI cost becomes manageable when it’s treated as part of how the system behaves in production, not as something you discover later in a billing report. Token usage, model selection, workload attribution, and early feedback loops all rely on the same idea: cost needs to be visible at runtime and connected to the context engineers already use.
In practice, implementing this consistently across services, models, and workflows isn’t trivial. That’s where platforms like Randoli come in, by bringing GenAI cost signals into existing observability workflows, so teams can see token usage, model behavior, and spend in the same place they debug performance and reliability.
.png)
.png)


