5 Tips for Monitoring Kubernetes Spend
August 28, 2025
Tags:
Best Practices
Cost Management
OpenCost
If you have any interest in reducing the cost of your Kubernetes cluster, here’s a quick, easy and free way to start: install OpenCost on your k8s cluster. Once it’s installed, OpenCost will start tracking the Compute cost of all your workloads from that point onwards - it doesn’t retroactively calculate the cluster costs.
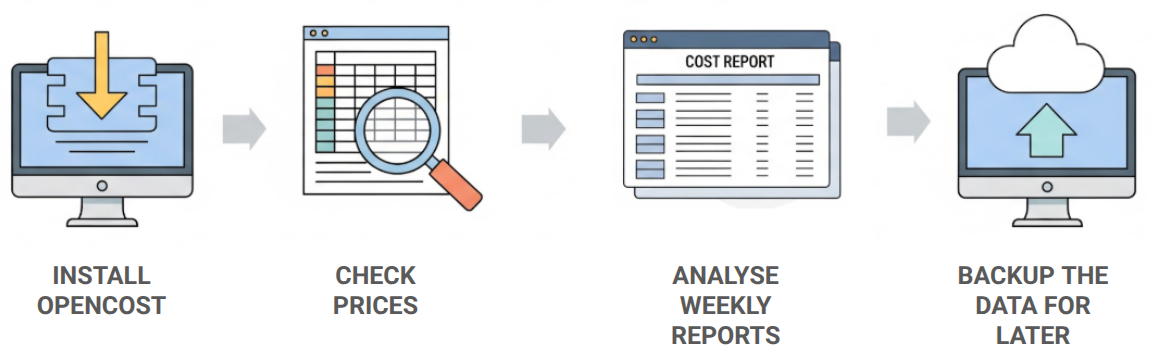
After it’s been running for a couple of days, you’ll start seeing useful data! Here are 5 pro tips for making the most out of your OpenCost installation.
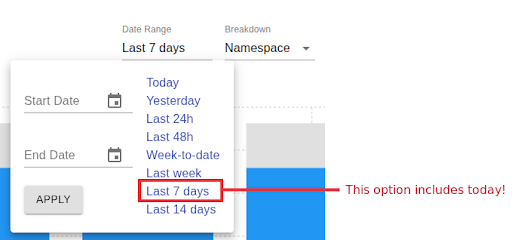
You may be tempted to look at your cost reports monthly, but that’s not a great idea when you’re using OpenCost, because it relies on Prometheus as its data store. That means the data lifetime is limited by the Prometheus retention period settings and the available disk space. If you wait too long, the data you want to see may no longer be available. Moreover, depending on the scale of your cluster and on the resource limits for the OpenCost and Prometheus pods, things may take too long or simply break if trying to handle too much data.
Weekly cost reports are a good compromise - not too much data, not too little. That said, don’t use the “Last 7 days” filter, because that includes today’s cost, and today’s cost data is always partial since today is not over yet. Instead, you’re better off using the “Last week” option or a custom range.
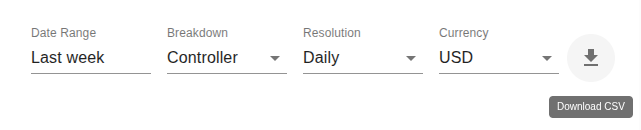
Ok, now we know that the OpenCost data doesn’t last too long. Still, we all know how useful it is to compare older data with newer data and analyze: is the cost going up or down? Why?
Thankfully, OpenCost has an easy-to-use “Export to CSV” feature. You just select the view you want (Date Range and Breakdown), and then press the “Download CSV” button. You now have all the data ready to be stored away and used with other tools, including your spreadsheet tool of preference. That’s how you can see your Kubernetes cost data on Excel, Calc, Sheets and similar tools.
Don’t want to bother downloading these files manually? You can setup a CSV Exporter (or a Parquet Exporter) to automatically do it for you.
The Compute cost reported by OpenCost (CPU, Memory and GPU) is calculated based on resource requests, resource usage, and node prices. OpenCost does a great job of finding the correct prices, but there’s still a chance the price may be wrong. It’s a good idea to check that asap, since there’s no way to retroactively change it.
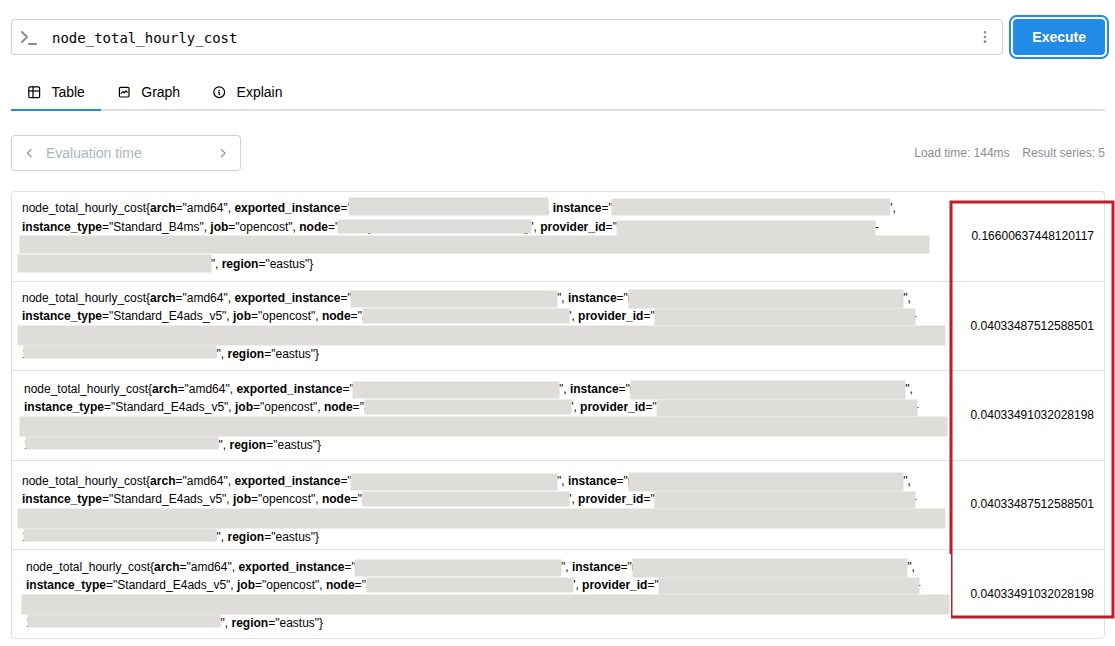
To check the node prices, you’ll need to open up your Prometheus instance’s UI and query for the “node_total_hourly_cost” metric. As an example, the redacted image above shows a small cluster with 5 nodes: one node costs ~$0.166 per hour, and four other nodes cost ~$0.04 per hour. I checked that against the pricing calculator of my vendor, and it turned out to be correct, yay! If that wasn’t the case, you could:
While you’re at it, why not check the private volume prices too? For that, query for the “pv_hourly_cost” metric. Prices are reported as price per GB per hour.
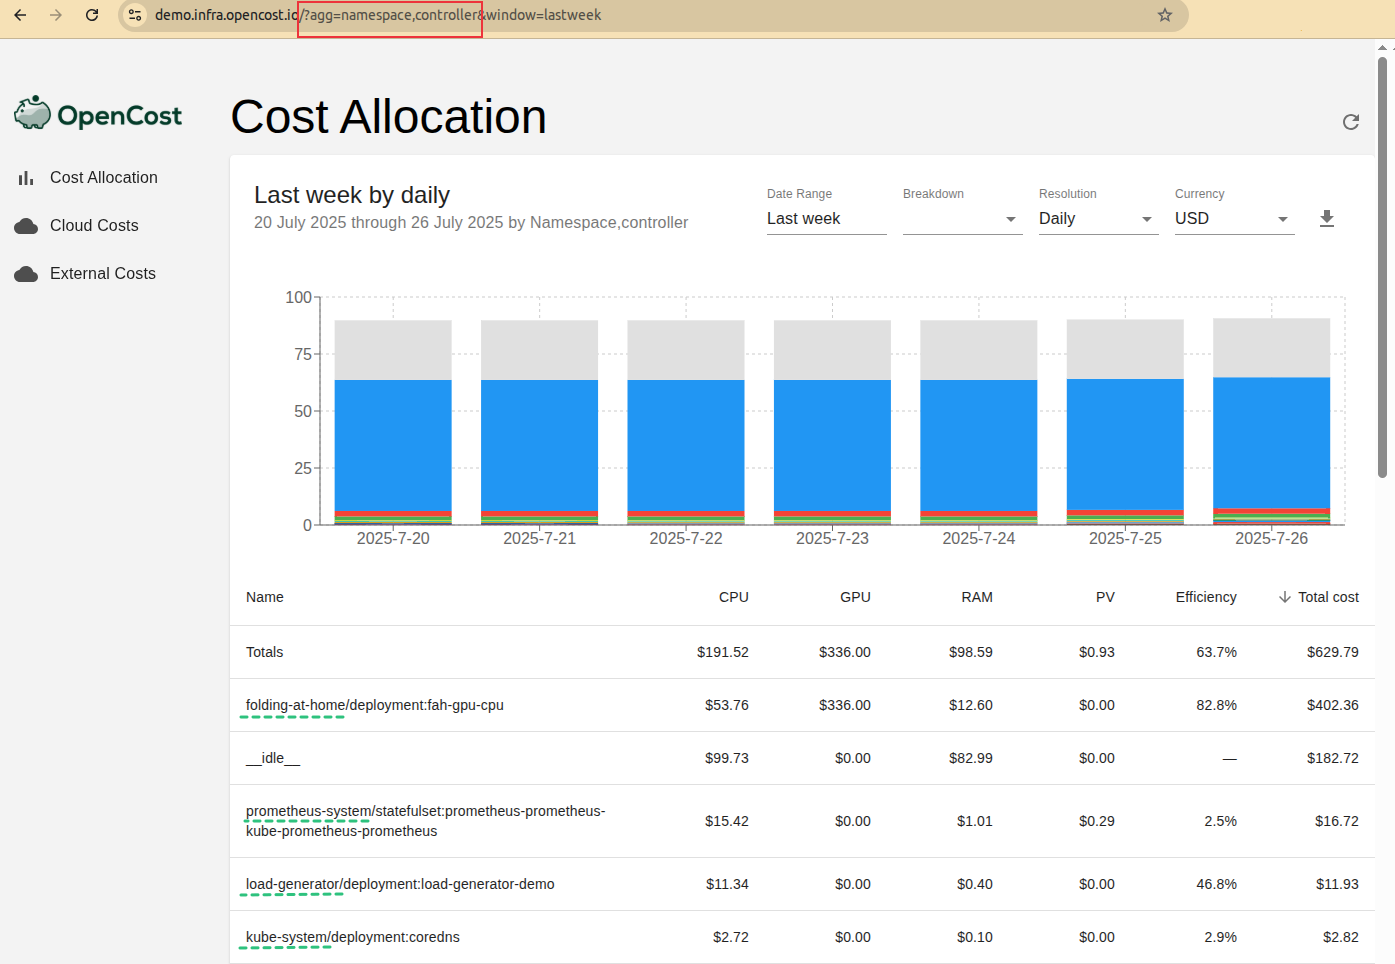
The “Controllers” breakdown is super helpful, as it aggregates all pods that belong to the same deployment, statefulset, or daemonset. This way, instead of looking at each pod individually, I can understand the cost of the entire workload with all its pods combined.
Nevertheless, the controller name is often not enough for me, especially in the case of multi-tenant clusters or multiple environments in the same cluster. When that happens, I resort to a hidden feature called multi-aggregation.
This feature can’t be accessed directly through the UI: you need to manually change the “agg” query param in the browser’s address bar. Aggregating by both namespace and controller name, I’ll see both names in the cost report. Here’s an example, with the namespaces highlighter with a green dashed line.
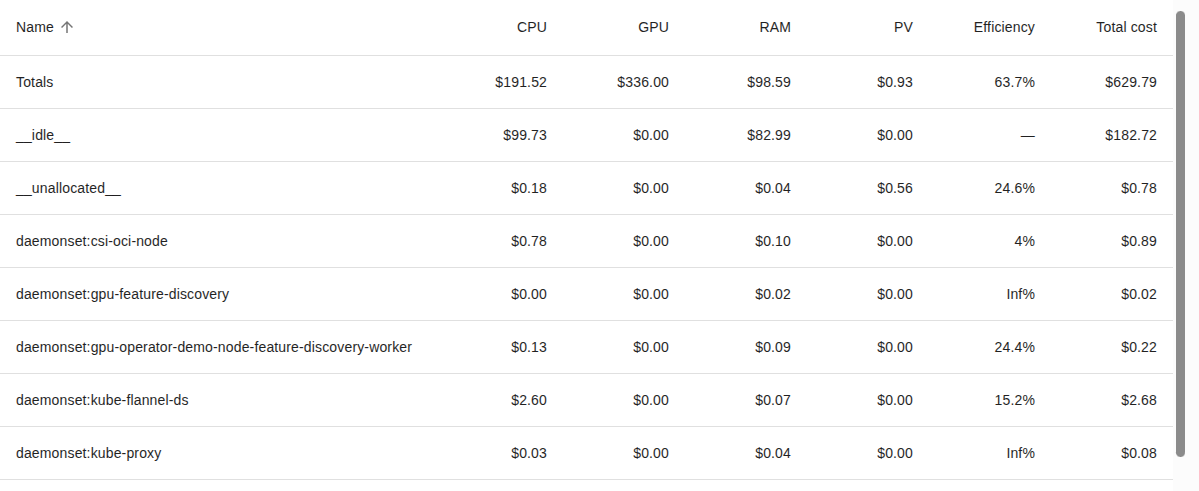
By default, the cost allocation report shows the entries sorted from highest to lowest total cost. Most of the time, that’s what you’ll want, but in some cases you’ll want to know which namespaces are less efficient, which controllers use the most GPU, or simply find the cost of a specific controller in that sea of paginated data.
In those cases, it pays off to know that you can sort the cost table by any column you desire, ascending or descending! Just click at the column header and voilà!
In the example below, the arrow next to "Name" indicates that the cost entries are being sorted alphabetically.
Those tips will help you make more effective use of OpenCost, but that's only the start of your cost management journey. Now that you're all set up, continue on by reading our Full Guide to Kubernetes Cost Management.
.png)
.png)


